Use the filter to limit your results.


Objectives
Students will know how temperature changes impact organisms and ecosystems and be able to discuss several climate change-related impacts on the Hudson River ecosystem.
Overview
Rating:
- Students will use historical air temperature and Hudson River temperature data to create graphs
- Students will learn about three other animals whose populations have changed in the region
- Students will discuss the links between these population changes and temperature change
Materials
- Copies of the Student Worksheet (either for graphing in Excel or with graphs embedded)
- Computers with Excel with pre-loaded datasets (if students are to complete the graphing; or assign the graphing for homework)
Procedure
Preparation:
Students should be familiar with the concept of global warming and have basic graphing skills using Excel if you choose the first option. An Excel tutorial is provided within the Changing Hudson Project site.
Engage:
Ask: What do you know about global warming? What types of impacts have you heard about or seen? Show students photos of global change—melting glaciers, flooding, and precipitation changes. Use the PowerPoint titled “Climate Change” for images. If students have not had much background on the science of climate change, you can spend more time on this using the powerpoint. Ask: What types of changes might you expect in the Hudson Valley if temperatures continue to increase? Make a list on the board of student ideas. This can be done as a K-W-L chart or a conceptual circle if appropriate.
Explore:
There are two options for this lesson, depending on whether you want your students to have more experience with graphing data. If this is not an objective for your class, use Option 2.
Option 1: Students use Excel to create graphs | Option 2: Students use pre-made graphs |
1. Students graph annual air temperature data for Poughkeepsie using Excel. Graphing temperature should be done in Celsius to allow for comparisons. See “Hudson River Temperature without Graphs”.
| 1. Students use provided graphs to answer the same questions. See “Hudson River Temperature Worksheet with Graphs”.
|
2. Show students the video, "Could Just One Degree Change the World? | National Geographic" at https://www.youtube.com/watch?v=2_ZQRIsn2pA and "2 Degrees Warmer: Ocean Life in Danger | National Geographic" at https://www.youtube.com/watch?v=P-0_gDXqYeQ They will then answer the question about how the planet will change with an increase in temperature of 1-2 °C. | |
3. After discussing the changes in air temperature, students should be encouraged to think about what this might mean for water temperature.
| |
4. Using the yearly average temperatures, students graph yearly deviations from the long term average. This sorts the data into years with above- versus below-average temperatures for the Hudson River. They then answer the questions based on this graph and data about aquatic organisms that is provided on “Using Data: Hudson River Temperature Worksheet.”
| 4. Using the same handout (“Hudson River Temperature Worksheet with Graphs”) as Option 2 above, students use the provided data to answer questions about the changes in the Hudson River. |
5.Students complete the worksheets using the graphs to look at changes in fish and frog species in the area.
| |
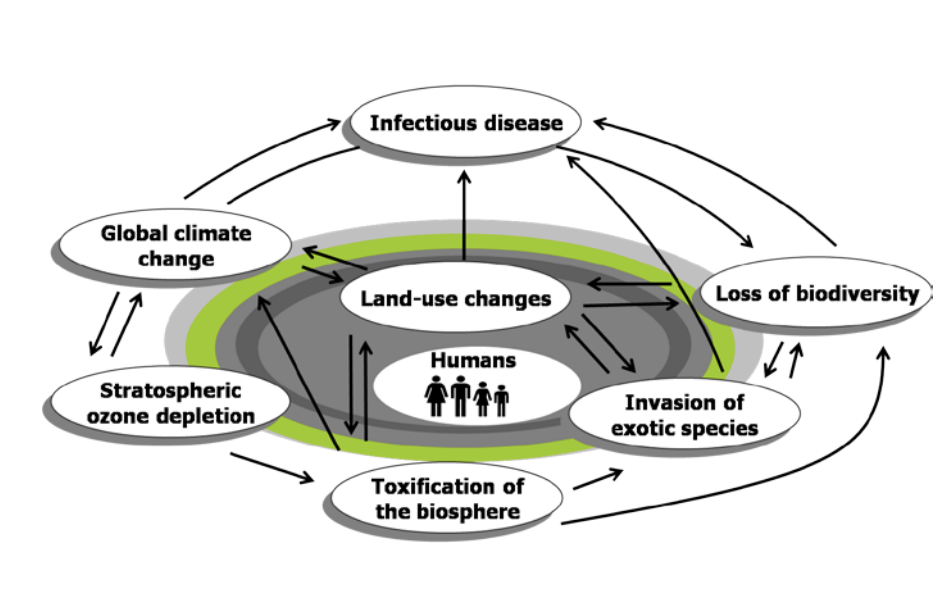
Lead a discussion with students based on the “Human Accelerated Environmental Change” diagram by Dr. Gene Likens. Ask students to talk about the ways in which human impacts can affect animal populations. They may conduct research to construct a conceptual circle focusing on fish or amphibians.
Explain:
According to data compiled and analyzed at the Cary Institute of Ecosystem Studies, the Hudson River has become warmer over the last 60 years. These data were collected daily at the Poughkeepsie Water Treatment Facility, and three USGS survey sites Poughkeepsie [01372058] (https://waterdata.usgs.gov/nwis/inventory/?site_no=01372058 ), South Dock at West Point [01374019] (https://waterdata.usgs.gov/ny/nwis/uv/?site_no=01374019&PARAmeter_cd=72… ), and south of Hastings on Hudson [01376304] (https://waterdata.usgs.gov/nwis/dv?referred_module=sw&site_no=01376304 ). The data were then averaged to create daily and monthly means.
Although no correlation studies have been done between the decrease in certain fish species and the increasing temperature of the Hudson River, it has been suggested by a number of scientists that this is a distinct possibility. In a paper by Daniels et al. 2005, the tomcod’s temperature sensitivity is listed as a possible reason for its disappearance from the Hudson. Once found as far south as North Carolina, it is now rarely found even in the Hudson. Atlantic Tomcod and Rainbow smelt require cold water for breeding, and are already at the southern portion of their range in the Hudson River. According to John Waldman, a biology professor at Queens College in New York who has long been involved in Hudson River issues, between 1996 and 2000, yearly sampling for smelt in the Hudson produced a total of 4 fish.
The data from the Gibbs & Breisch 2001 study shows a change in breeding times for a variety of local amphibians, many of whom are now starting ‘calling’ up to two weeks earlier than one hundred years ago.
Extend:
- Students can graph two other air temperature data sets: “Student Maximum Air Temp Poughkeepsie” and “Student Minimum Air Temp Poughkeepsie.”
- Students could also graph more than one location across the country or at different elevations in New York and compare the rate of temperature changes. See: https://cdiac.ess-dive.lbl.gov/epubs/ndp/ushcn/ushcn.html (US Historical Climatology Network web interface).
- Students could compare temperature graphs to CO2 level graphs on a global basis here: https://gml.noaa.gov/ccgg/ (NOAA Global Monitoring Carbon Cycling Network).
- Encourage students to conduct further research into possible impacts including sea level rise, impacts on wetlands, the movement of the salt front in the river, and weather patterns that could impact drinking water.
Evaluate:
Use student answers on the worksheets to assess their understanding. Students should be able to discuss the implications of climate change on some of the local organisms.
Resources
Lesson Files
pdf
Answer key
pdf
Hudson River Temp Worksheet
pdf
Hudson River Temperature Worksheet for ExcelStandards
Benchmarks for Science Literacy
1B Scientific Inquiry, 4B The Earth, 5D Interdependence of Life, 5E Flow of Matter and Energy, 8C Energy Sources and Use, 8D Communication, 9D Uncertainty, 9E Reasoning, 11C Constancy and Change, 12A Values and AttitudesNYS Standards
MST 1 - Mathematical analysis, scientific inquiry, and engineering design, MST 4- Physical setting, living environment and nature of science, MST 6- Interconnectedness of mathematics, science, and technology (modeling, systems, scale, change, equilibrium, optimization)Credits
Daniels, R.A., K.E. Limburg, R.E. Schmidt, D.L. Strayer, and R.C. Chambers. 2005. Changes in Fish Assemblages in the Tidal Hudson River, New York. American Fisheries Society Symposium, 45:471-503.
Gibbs, J.P. and A.R. Breisch. 2001. Climate Warming and Calling Phenology of Frogs near Ithaca, New York, 1900-1999. Conservation Biology, 15:1175-1178.
Seaby, R.M.H. and P.A. Henderson. 2008. The Status of Fish Populations and the Ecology of the Hudson. Report by Pisces Conservation for the Riverkeeper.
Seekell, D.A., and M.L. Pace. Analysis of a Warming Trend in the Hudson River Estuary. Estuaries and Coasts (submitted ms.)
Williams, C.N., M.J. Menne, R.S. Vose, and D.R. Easterling. National Climatic Data Center, National Oceanic and Atmospheric Administration.