Use the filter to limit your results.


Objectives
Through a game and outdoor investigation, students compare the behavior of animals in different areas of the schoolyard and experience an authentic ecological research method. The collect and display their data in appropriate graphs in order to examine the factors that influence an animal's ability to survive.
Overview
Rating:
Students begin by playing a game that simulates research done by Cary Institute ecologists studying the factors that influence mice foraging. Then, students conduct an investigation on small mammal foraging in their schoolyard.
Materials
Game:
• 3 or 6 trays (such as a large aluminum baking tray)
• 50 peanuts per tray (can also use other large nut, marbles, similar rocks, etc)
• Approximately 6 pounds (2L) of sand per tray
• 3 or 6 pieces of rope to make a circle the size of a hula hoop (or use hula hoops)
• 1 large picture of owl or raptor silhouette (optional)
• 3 or 6 small paper lunch bags
• 1 or 2 covers made from 4 stakes (3-4 feet long) and a piece of dark cloth (approx. 3 by 3 feet)
• 1 or 2 nametags that read each of the following: Ticky, Healthy, Safe
• 1 or 2 pair of large gloves
• Large poster paper to draw graph
• Sieves or colanders for quick separation of peanuts and sand
• Basins (to sieve sand into)
Investigation:
• Small aluminum baking trays
• Sunflower seeds
• Approximately 3 pounds (1L) of sand per tray
• Sieves or colanders to separate sand and sunflower seeds
• Basins (to sieve sand into)
Procedure
Engage – Foraging Mice Game! - developed by Dr. Andrea Previtali, a Post-Doc researcher at the Cary Institute
The object of this game, is to gather as many peanuts (or other such objects) as possible from trays filled with sand, while pretending to be a mouse under a certain risk or health condition. This game is nearly an exact model of Dr Previtali’s research from the summer of 2009, when she and other ecologists were investigating the impact of predation risk, parasite load, and other energy-draining factors on how mice forage for food.
In this game, the students become the mice from Dr Previtali’s research. Some have many ticks on them (they will be wearing the big gloves, which simulate an impediment in the ability to gather food), others get to forage under a cover (so they are protected from predators), while others are out in the open. The number of seeds that each “mouse” can collect in 1-3 minutes are the total seeds gained for that “mouse”. The number of seeds gained for each round of the game is graphed and the class can discuss why these different “mice” had different degrees of success. The observed individual variation and the importance of collecting multiple data points in order to detect a pattern can also be discussed.
Students will be one of the following (you can play several rounds so all students can play once)
• Healthy mouse safe from predators (covered tray)
• Healthy mouse at risk of predators (uncovered tray)
• Ticky mouse at risk of predators (uncovered tray wearing gloves)
• Owl
Each mouse has a “burrow” (hula hoop or roped off area on ground), an assigned foraging tray with sand and 50 peanuts, and a paper bag.
Before beginning the game, ask the students to predict which mice will get the most and least peanuts.

Pretending that night is falling, the mice will leave their burrows in search for peanuts that they will collect in their paper bags. Mice have 1-3 minutes (depending on their age) to search for peanuts buried underneath sand in the trays. They should collect their peanuts in their paper bags. To increase the challenge, they could use only two fingers to collect a single peanut at a time. The unprotected mice (those in the uncovered trays) need to watch out for the “owl”. The owl will “fly” around the perimeter of the field for the entire length of the game. When the owl flies near the mice, the mice that are at risk of predators (uncovered trays) must run back to their burrows and carry their bag of peanuts with them. When the owl has left, they can run back to their assigned trays and keep collecting peanuts. The mouse that is under the cover is safe from predators and does not have to run to its burrow. At sunrise (when the time is up), all the mice have to return to their burrows.
They will then count how many peanuts they collected and plot the data point by marking an X on a graph of the number of peanuts for each treatment (safe, healthy, ticky).
Switch players and keep running the game to add to the dataset. Also, you can have more than one set of 3 mice playing at once.
Explore- look at the graph of the game data and discuss:
1. Do our results match what we predicted would happen?
2. Would our conclusions have changed if we only did the game once or twice?
3. What sort of investigation could we set up in our schoolyard
Explain
Every action the animal makes has both benefits and costs. For example, when an animal finds a place with lots of food (like seeds), it has to determine the risks from staying in that spot to eat. Maybe there are predators roaming or flying around, maybe the food is not of good quality, maybe the weather is poor or maybe another animal is already eating there. These are risks, or costs, associated with foraging at a particular site. So, as an animal feeds, there is a critical point at which the density of food available no longer outweighs the cost of feeding at that site. This is called the giving up density (GUD). When the giving up density of a food patch is reached, the animal will leave the site and forage somewhere else. Ecologists determine the GUD by placing trays filled with sand and a determined amount of seeds in the field for one or more days, and then count how many seeds are left. If many seeds are left (high GUDs) then one interpretation of this result is that the location of the tray was risky and so the mice spent little time foraging in that place. If many seeds are taken (low GUD) then it could indicate that the tray was located on a safer place to forage. Other factors that can affect the decisions of the animals on how much time to spend foraging on a particular patch of food are the number of competitors in the area, the abundance of food in that habitat, and the health and reproductive condition of the individual.
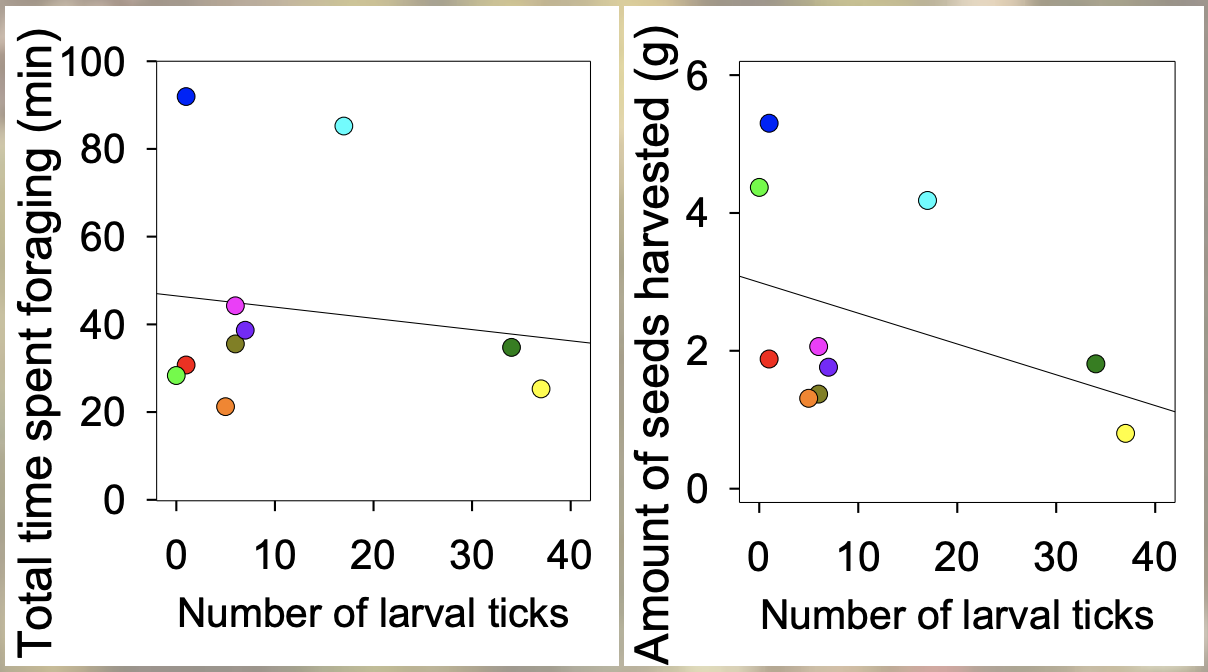
Dr. Previtali’s research showed that mice with large numbers of ticks spend the similar amounts of time foraging as mice with fewer ticks, but they tend to gather fewer seeds (see data from 6 mice in the Figure below). Ticks may affect mice’s efficiency at finding food by making them allocate time to grooming off the ticks instead of searching for food. She also found that, as predicted, mice spend more time and gather more seeds at the covered trays than in the uncovered trays. This result shows that mice are able to assess the risk of their environment and choose to forage in places whether the risk of predation is lower (See graph).
Elaborate- Foraging in your schoolyard
This study will allow you to ask questions about how giving up density changes in different habitats. Further investigation may indicate some of the physical and environmental factors that affect giving up density at each site and so allow a unique insight into the decision making processes of foraging animals.
1. Choose location and Question
The number of trays and locations you use depends on the comparison you want to set up. To detect the effect of predation risk you might choose to place food stations under a shrub and next to, but away from, a shrub or other type of cover. You could also compare moon and moonless nights of the same moon cycle. To detect the effect of habitat quality you could also compare 2 habitats that may be different in the density of mice or in the availability of food.
2. Prepare foraging tray
Place 50 sunflower seeds at the bottom of each aluminum baking tray. Fill the aluminum baking trays with dry sand. Please note that the number of seeds depends on how long trays will be left outside, the habitats in which the trays will be placed, and the number of foraging animals in the area. Start with 50 seeds per tray left outside for 1 night. You can run some trials before starting the main project to see if this is a good number. Take into consideration that if all seeds are eaten then you can’t compare the GUD between sites.
3. Place 2 or more food stations in each location. Leave them overnight.
Having a number of food stations at each plot will help the results show the real effect different habitats have on giving up density as opposed to results being influenced by chance or random factors. It might take animals time to find the food and get used to the new objects in their environment. So, if there are no seeds taken in one night, leave the trays for another night.
4. Collecting data
Collect each food station and count the number of whole seeds that remain. Don't count empty shells, since some animals are just messy eaters. Calculate the number of seeds remaining: 50- Number of seeds eaten = GUD.
Evaluate
1. What environmental, physical, or biological factors may encourage animals to feed at the site with the lower GUD?
- Could you collect data on the temperature, percent of vegetation cover, or light intensity or some other factor to understand the environmental differences between the habitats?
2. Student assessment Questions:
- List as many variables as you can think that would affect the foraging behavior of a small mammal like a mouse. How could you determine which variable is most important in determining behavior?
- How would you improve this study if you did it a second time?
- If your schoolyard has many safe places for mice and other small mammals to forage, what does that mean for the abundance of mice you have in the schoolyard? How could that affect other living things in the schoolyard? Remember that mice disperse seeds, compete with other animals for food and space, are food for predators like snakes and owls, can host infectious diseases like Lyme and eat bird eggs and gypsy moths. What if there are only a few safe places in your schoolyard?