Hudson River Conditions During Hurricane Irene Data
You can also explore this dataset on TUVA, an interactive graphing platform.
Background
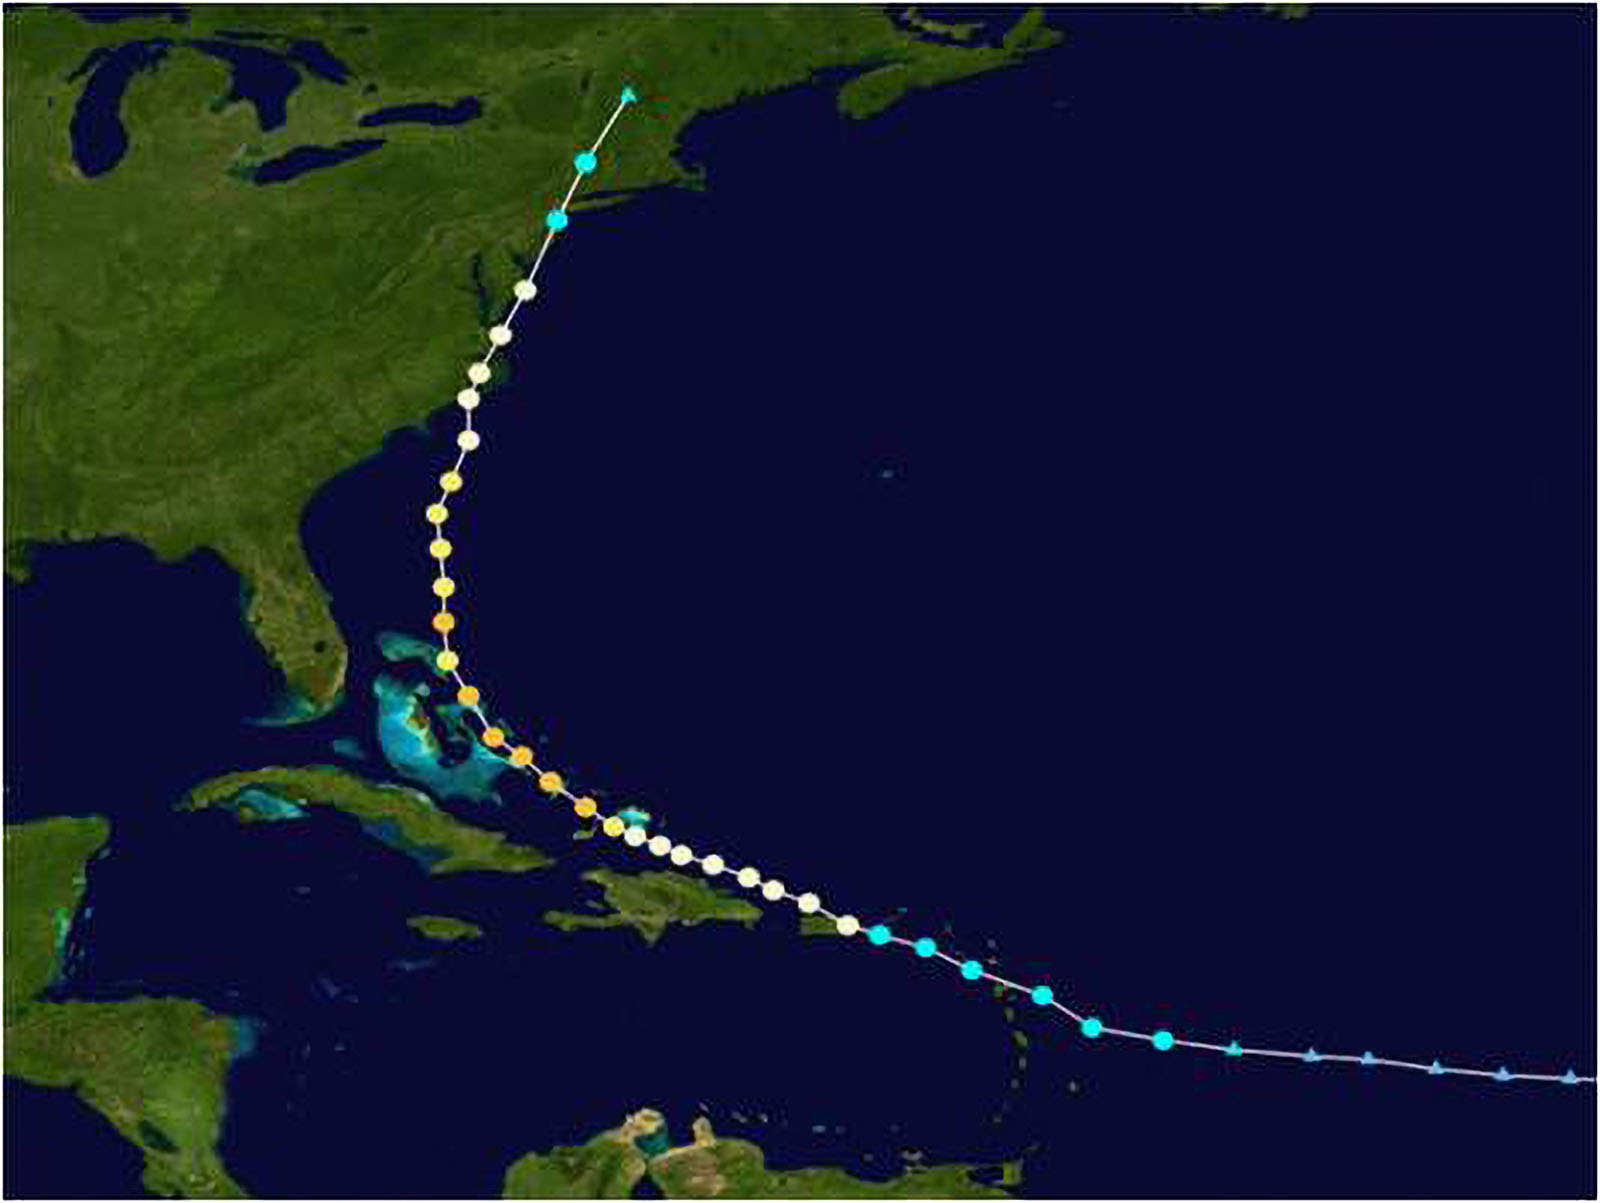
Hurricane Irene caused extensive flood and wind damage as it traveled across the Caribbean and up the East coast of the United States. The Hurricane made landfall in the United States near Cape Lookout, North Carolina on August 27th, 2011 and was downgraded to a Tropical Storm by the time it hit the New York City region on Sunday, August 28th, 2011.
Using data from the Hudson River Environmental Conditions Observation System (HRECOS) you can track the storm and its effect on the river. HRECOS uses automated sensors to record real-time data on Hudson River conditions (temperature, dissolved oxygen, etc) and weather (rainfall, wind speed, etc.) You may want to compare this dataset to our related dataset on Hurricane Sandy to examine how hurricanes can affect the river differently through oceanic storm surge or watershed flooding.
Additional Resources
We have a related lesson on Hurricane Floyd, which you may wish to complete before using this dataset.
Data Sampling & Compilation
Data Source: “Hudson River Environmental Conditions Observing System". 2011. Various stations. Accessed August 18th, 2017. http://www.hrecos.org/.
Prepared by: Carmen Glenn (New Rochelle HS) & Tom Tokarski (Woodlands HS)