Conditions in the Hudson River Data (external site)
Background
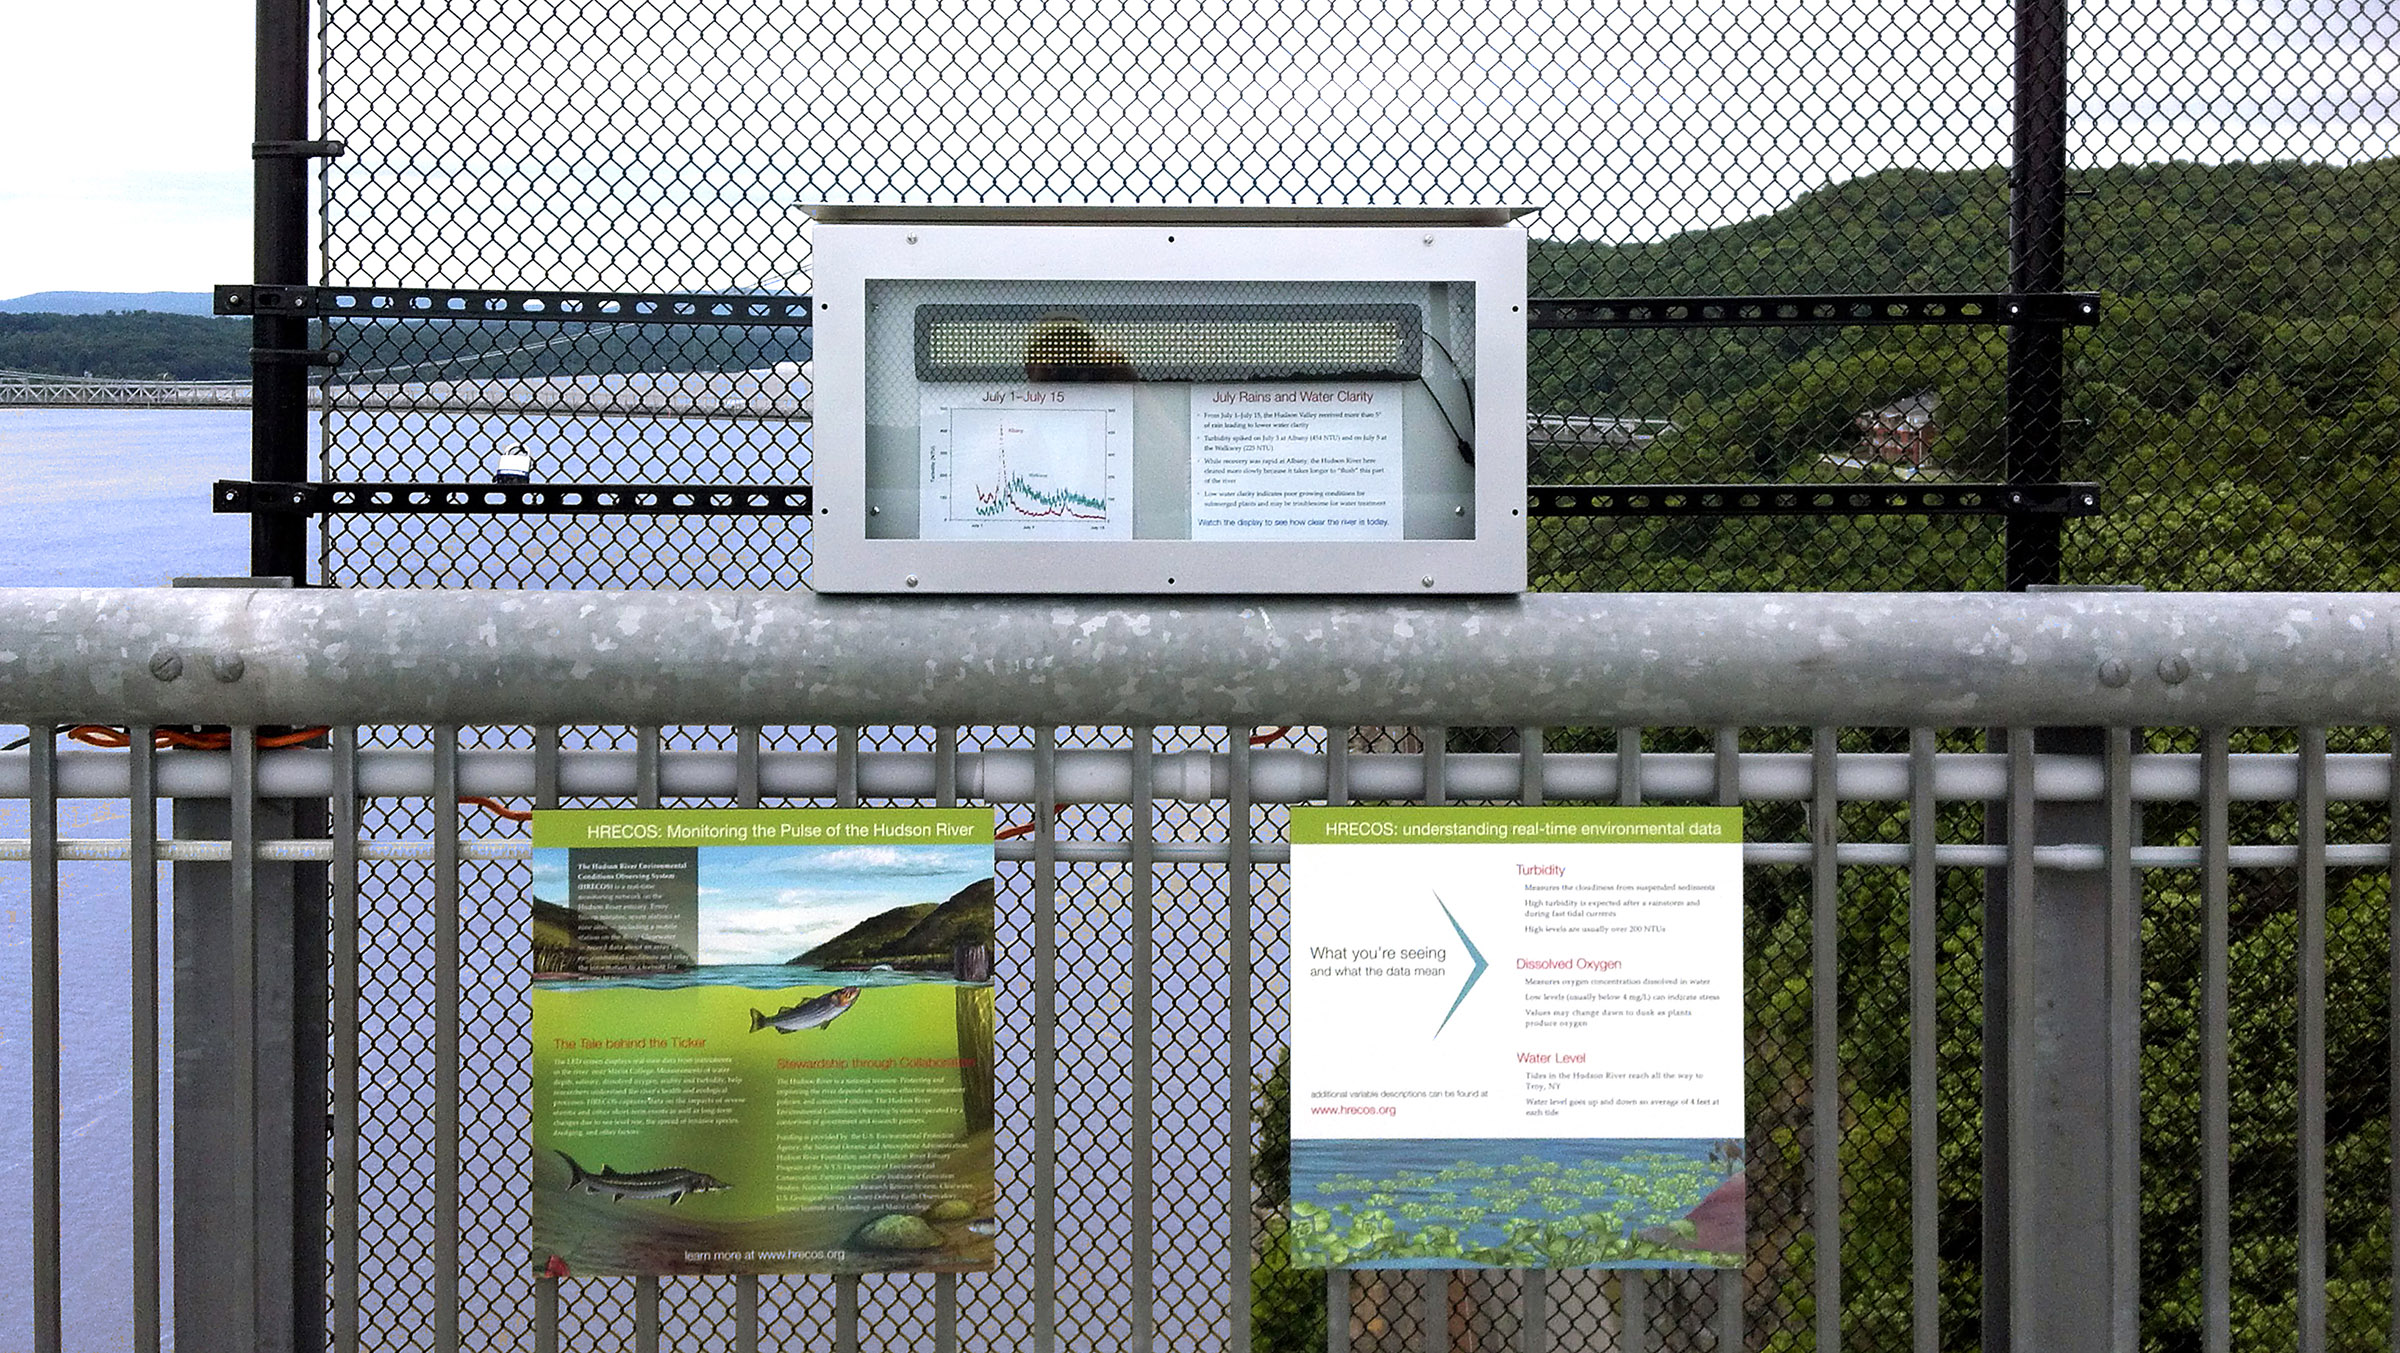
The Hudson River Environmental Conditions Observing System (HRECOS) is a network of real-time monitoring stations along the Hudson River. This network includes several stations from the New York/New Jersey harbor up to Schodack Island. Data are sampled continuously, every 15 minutes, and sent to the online database.
Current conditions in the Hudson River are available through the HRECOS Urban Ocean Observatory at Davidson Laboratory. This website will allow you to select one or two sampling stations, one or two parameters (acidity, depth, dissolved oxygen, salinity, specific conductivity, turbidity, or water temperature), and the dates that you would like to plot.
You can plot your graph right on the website or download a copy for yourself.
Note: when downloading graphs through the HRECOS website, you may be asked to take a short "users survey." This information is for HRECOS internal use only and will not be shared with outside parties.
Additional Resources
Historical Hudson River Data are also available through HRECOS. This website allows you to browse a list of historical data, organized by sampling station, and download the year or metadata file of your choice. Data files for each year will be downloaded as .csv files and can be opened using Excel.
Note: you will not be able to access this data through the HRECOS website without first taking a short "users survey" by clicking on the large red box on the right-hand side of the page. This information is for HRECOS internal use only and will not be shared with outside parties.
Below is a sample graph you can make from the historical Hudson River data posted on the HRECOS website. We encourage you to visit their website to view more data and come up with your own trend or comparison.
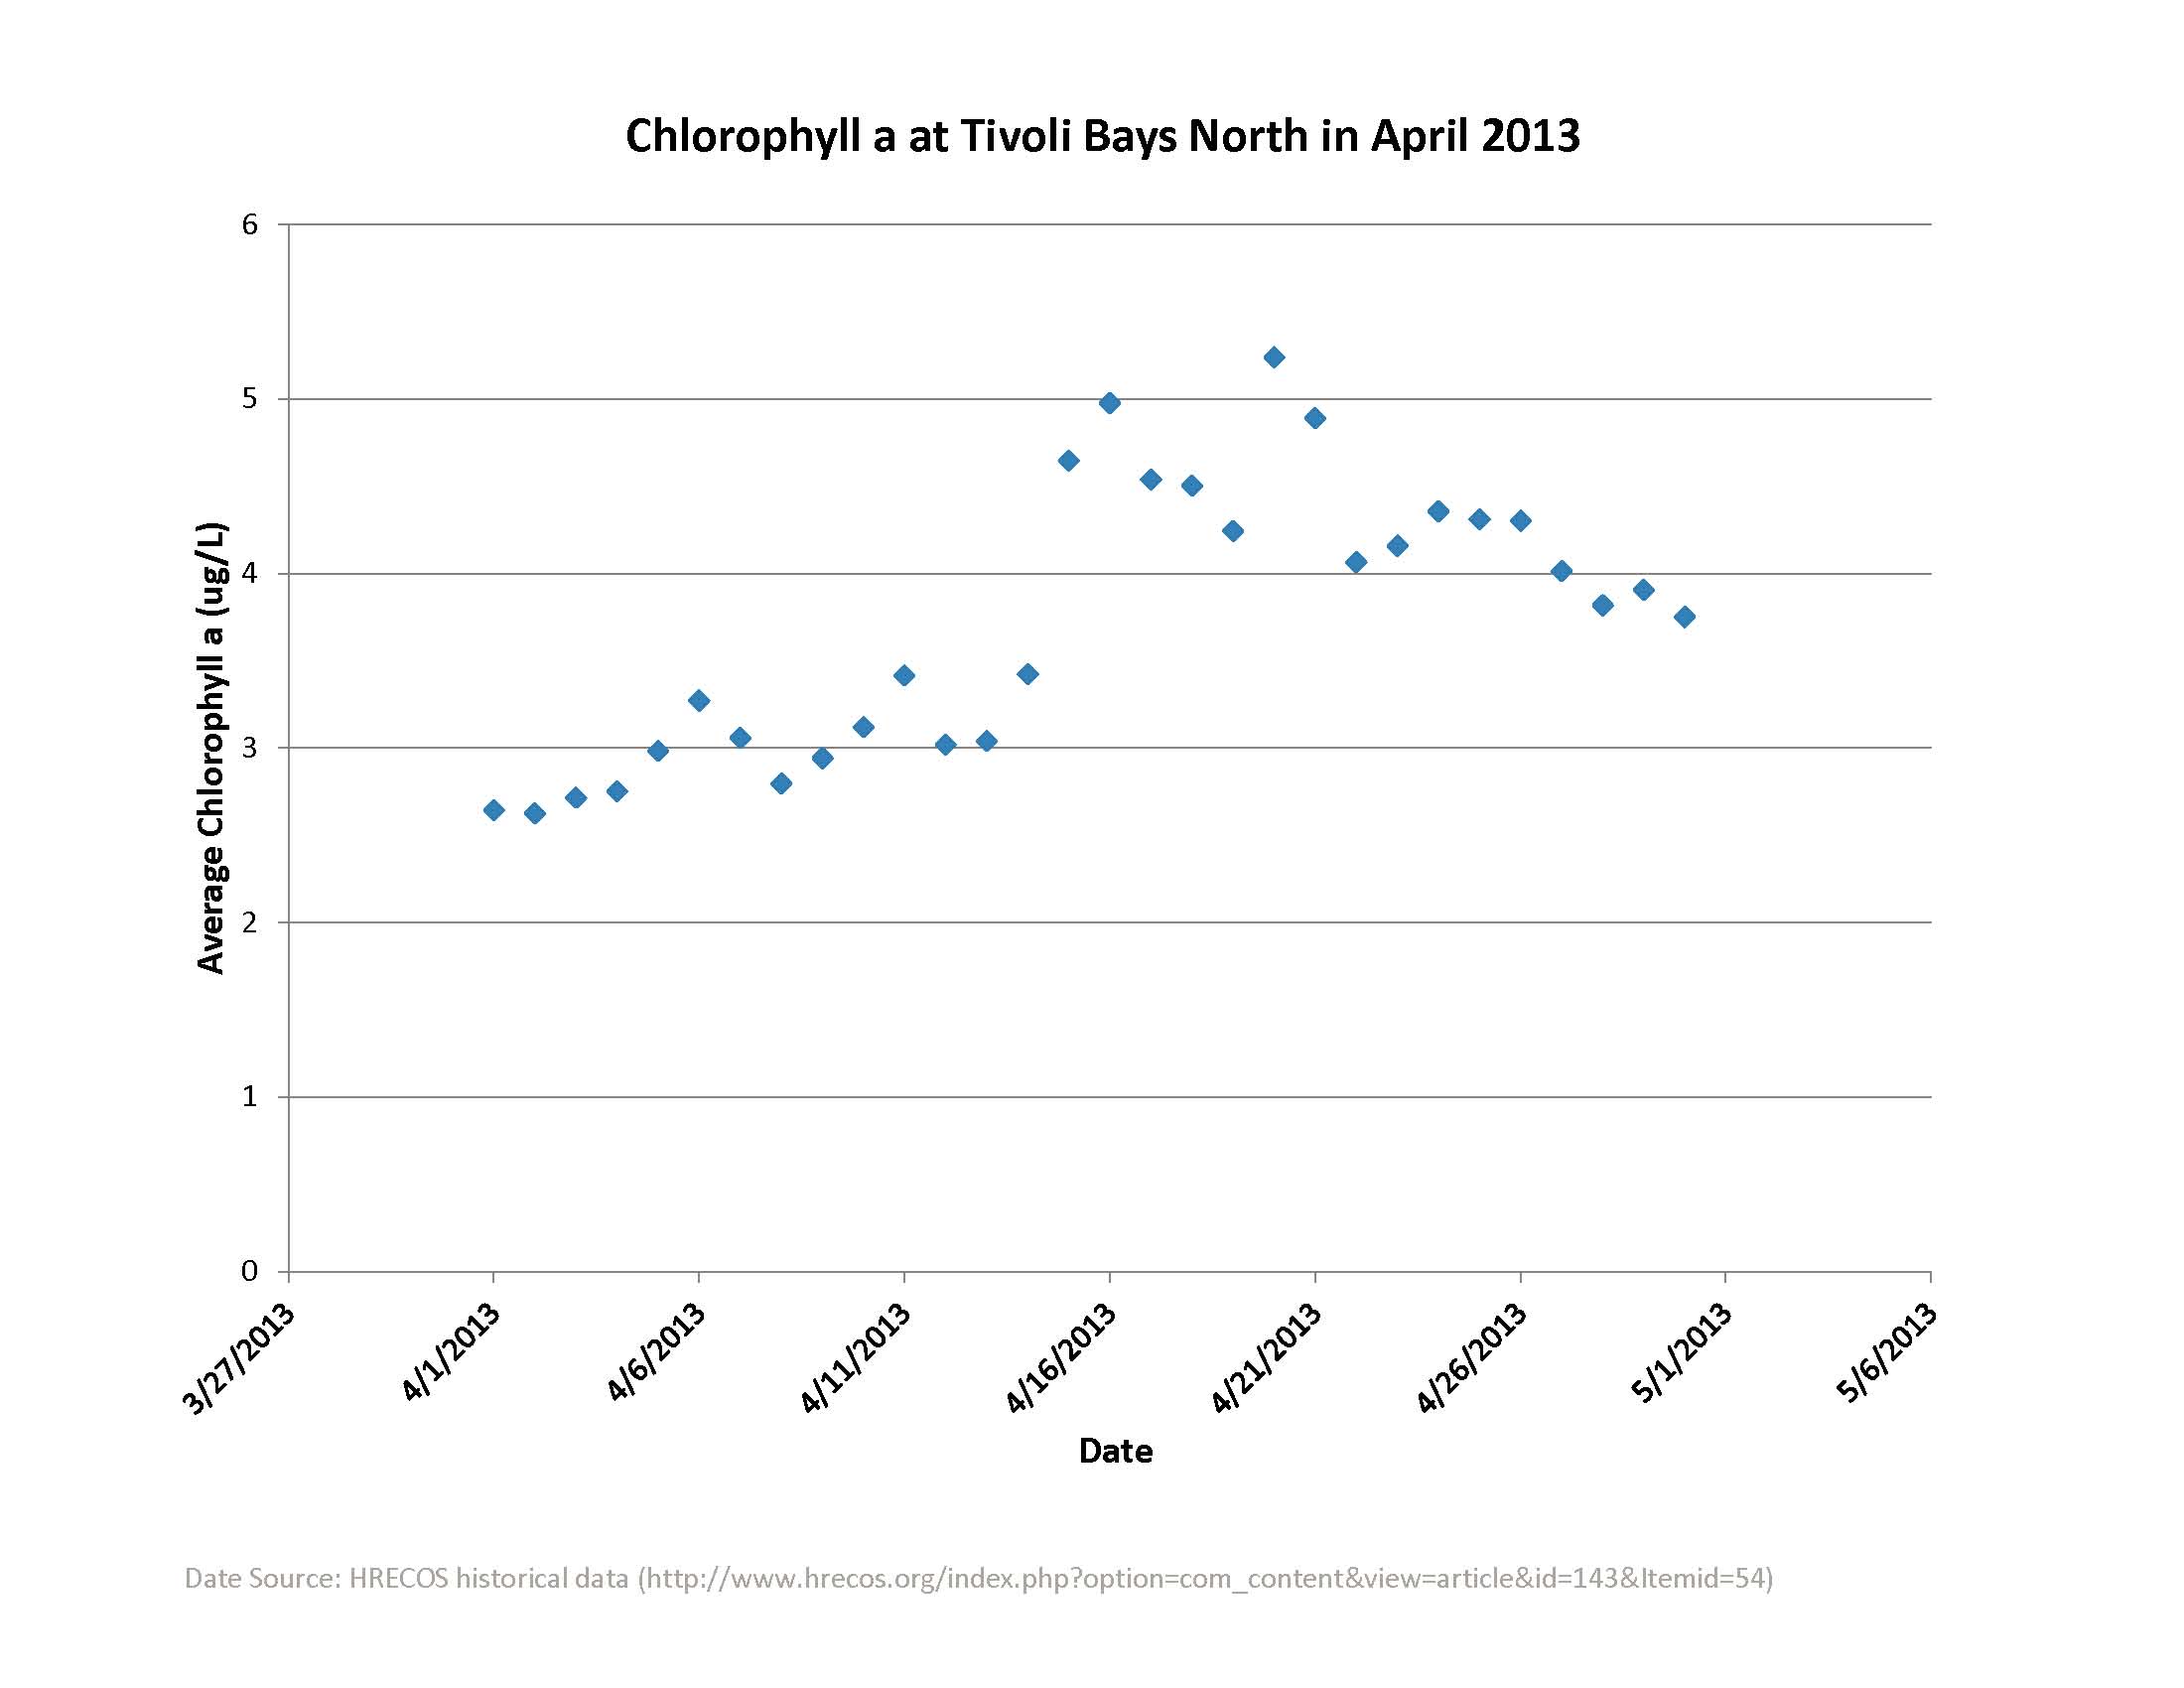
(Important: The HRECOS data are real raw data, so they will appear messy and complicated at first glance. For an introduction to using the HRECOS data, check out the lesson plans page.)
For a sample of trends you could describe using the HRECOS data you may be interested in these HRECOS data puzzles made by Steve Stanne, Estuary Education Coordinator for the Hudson River Estuary Program.