


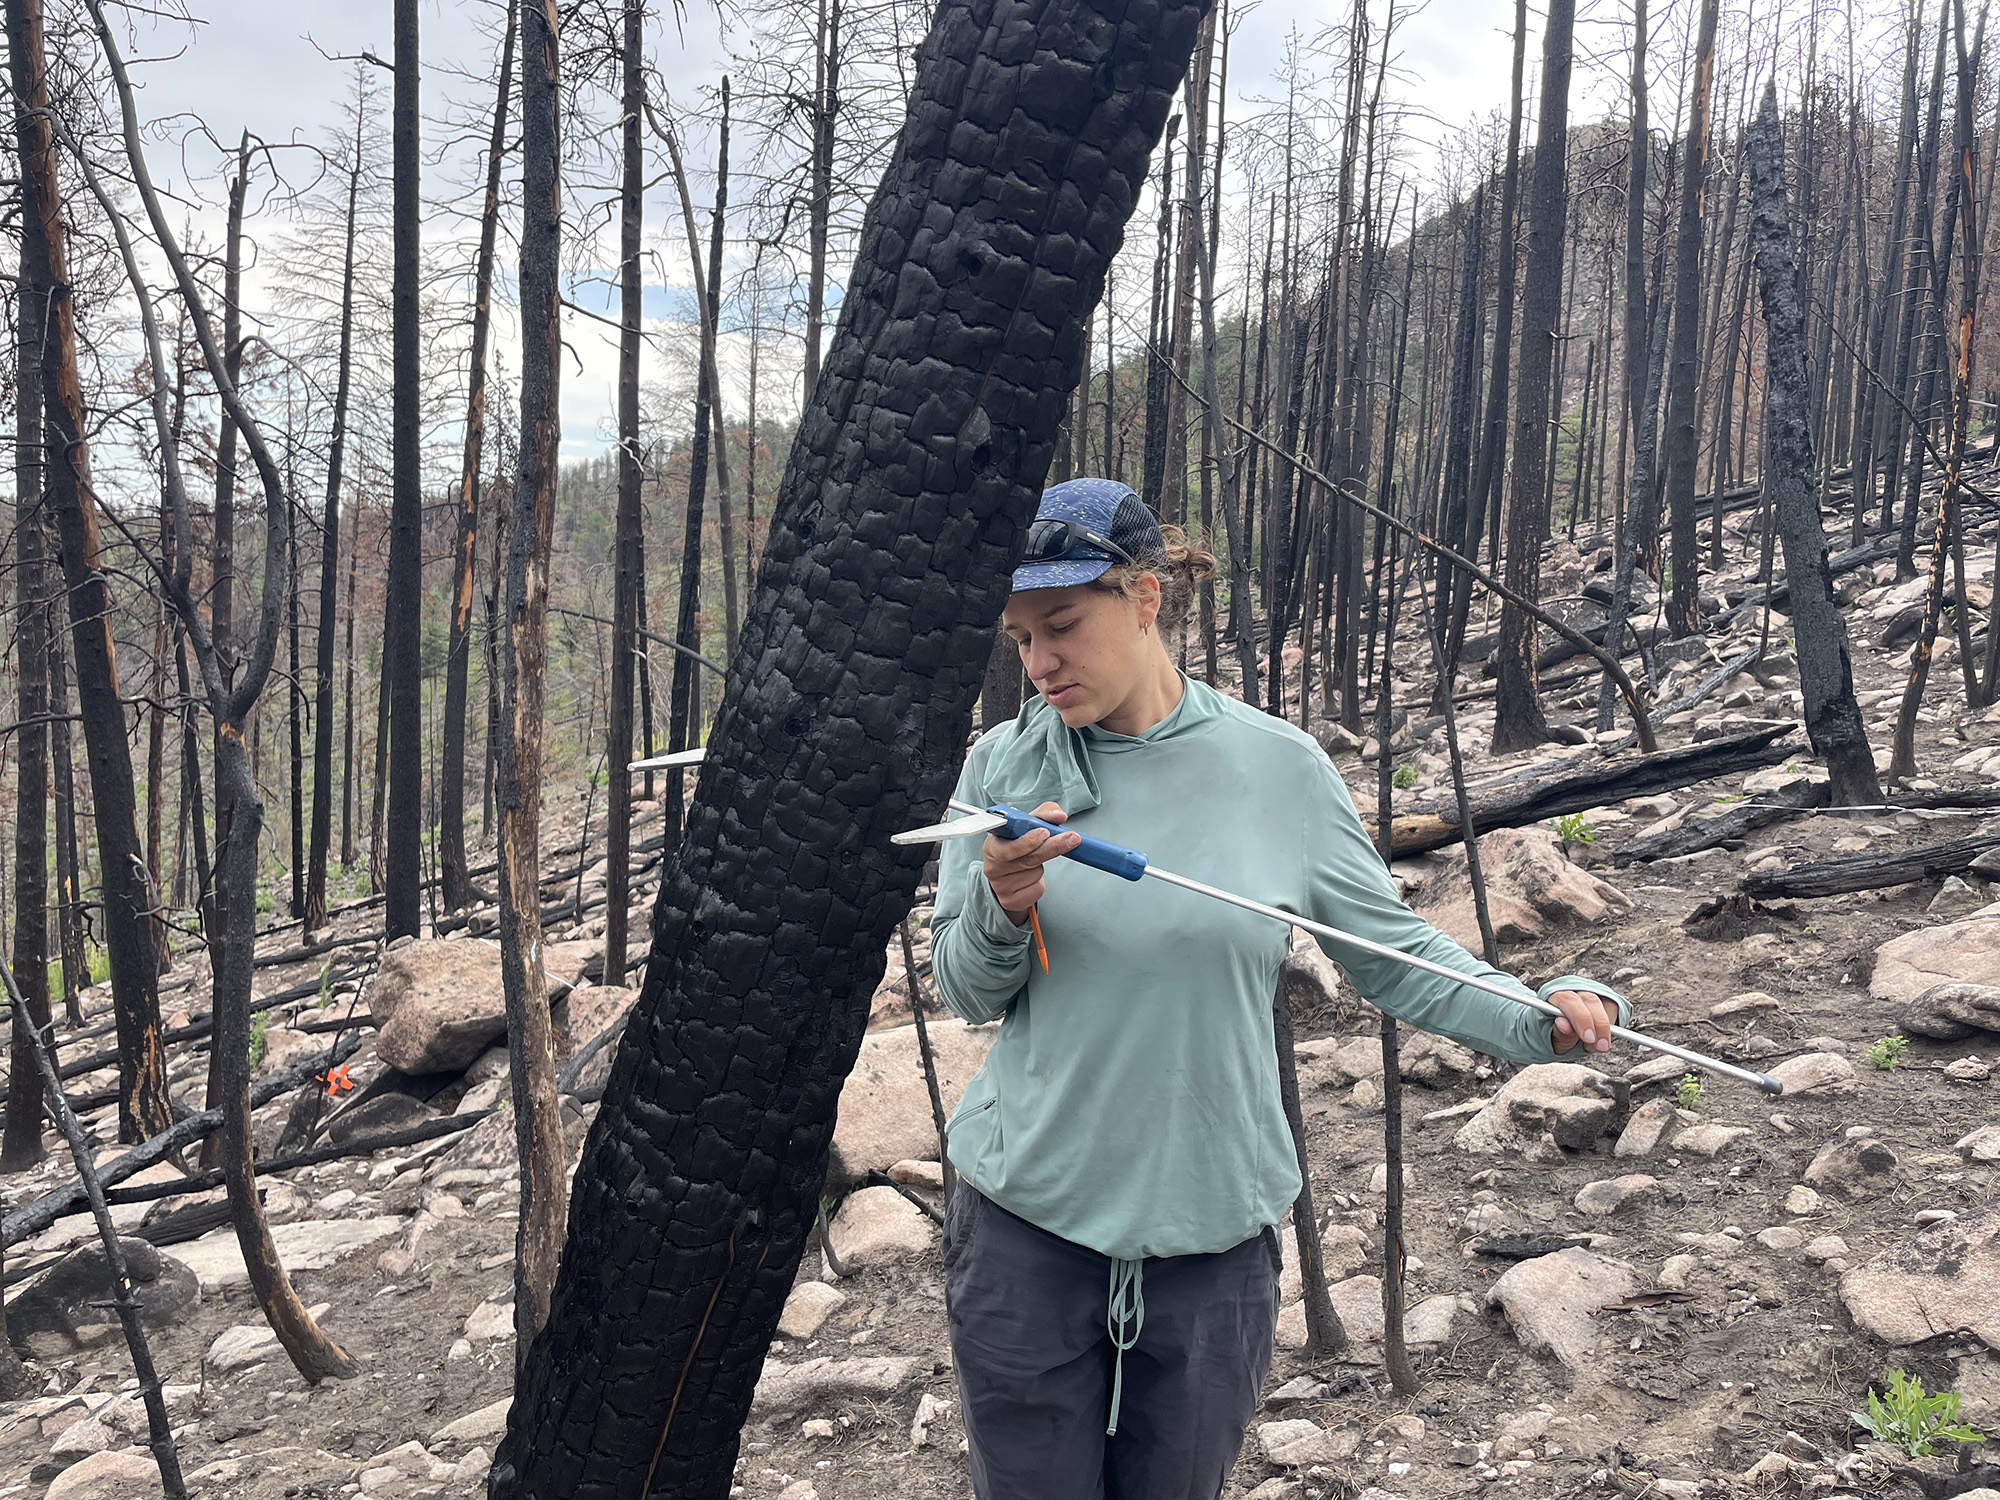
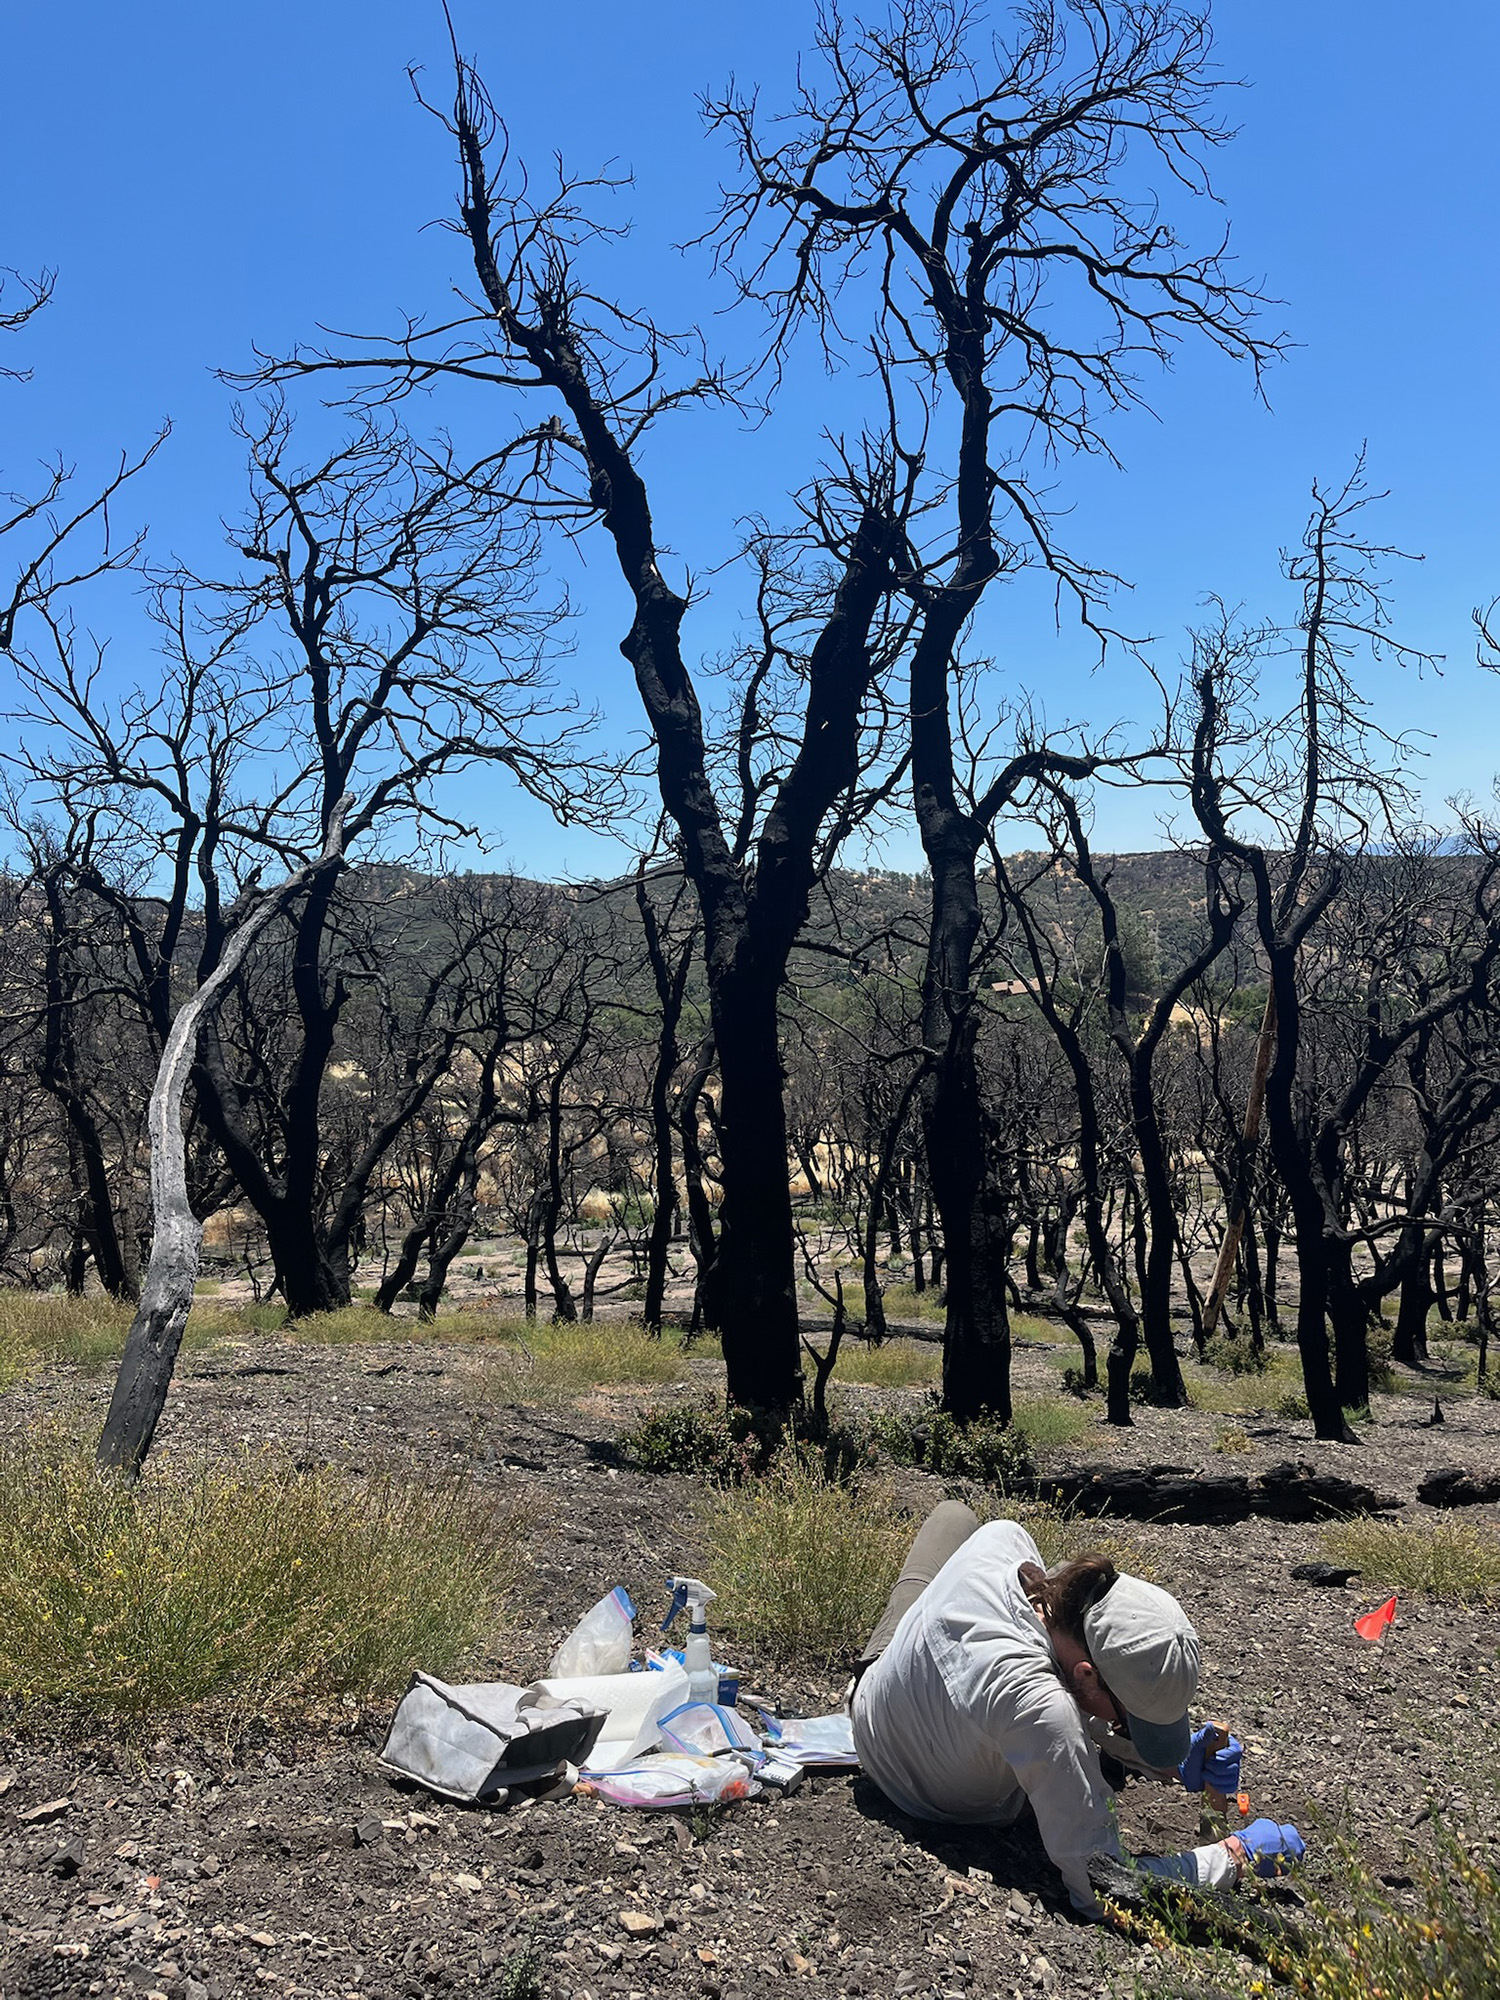
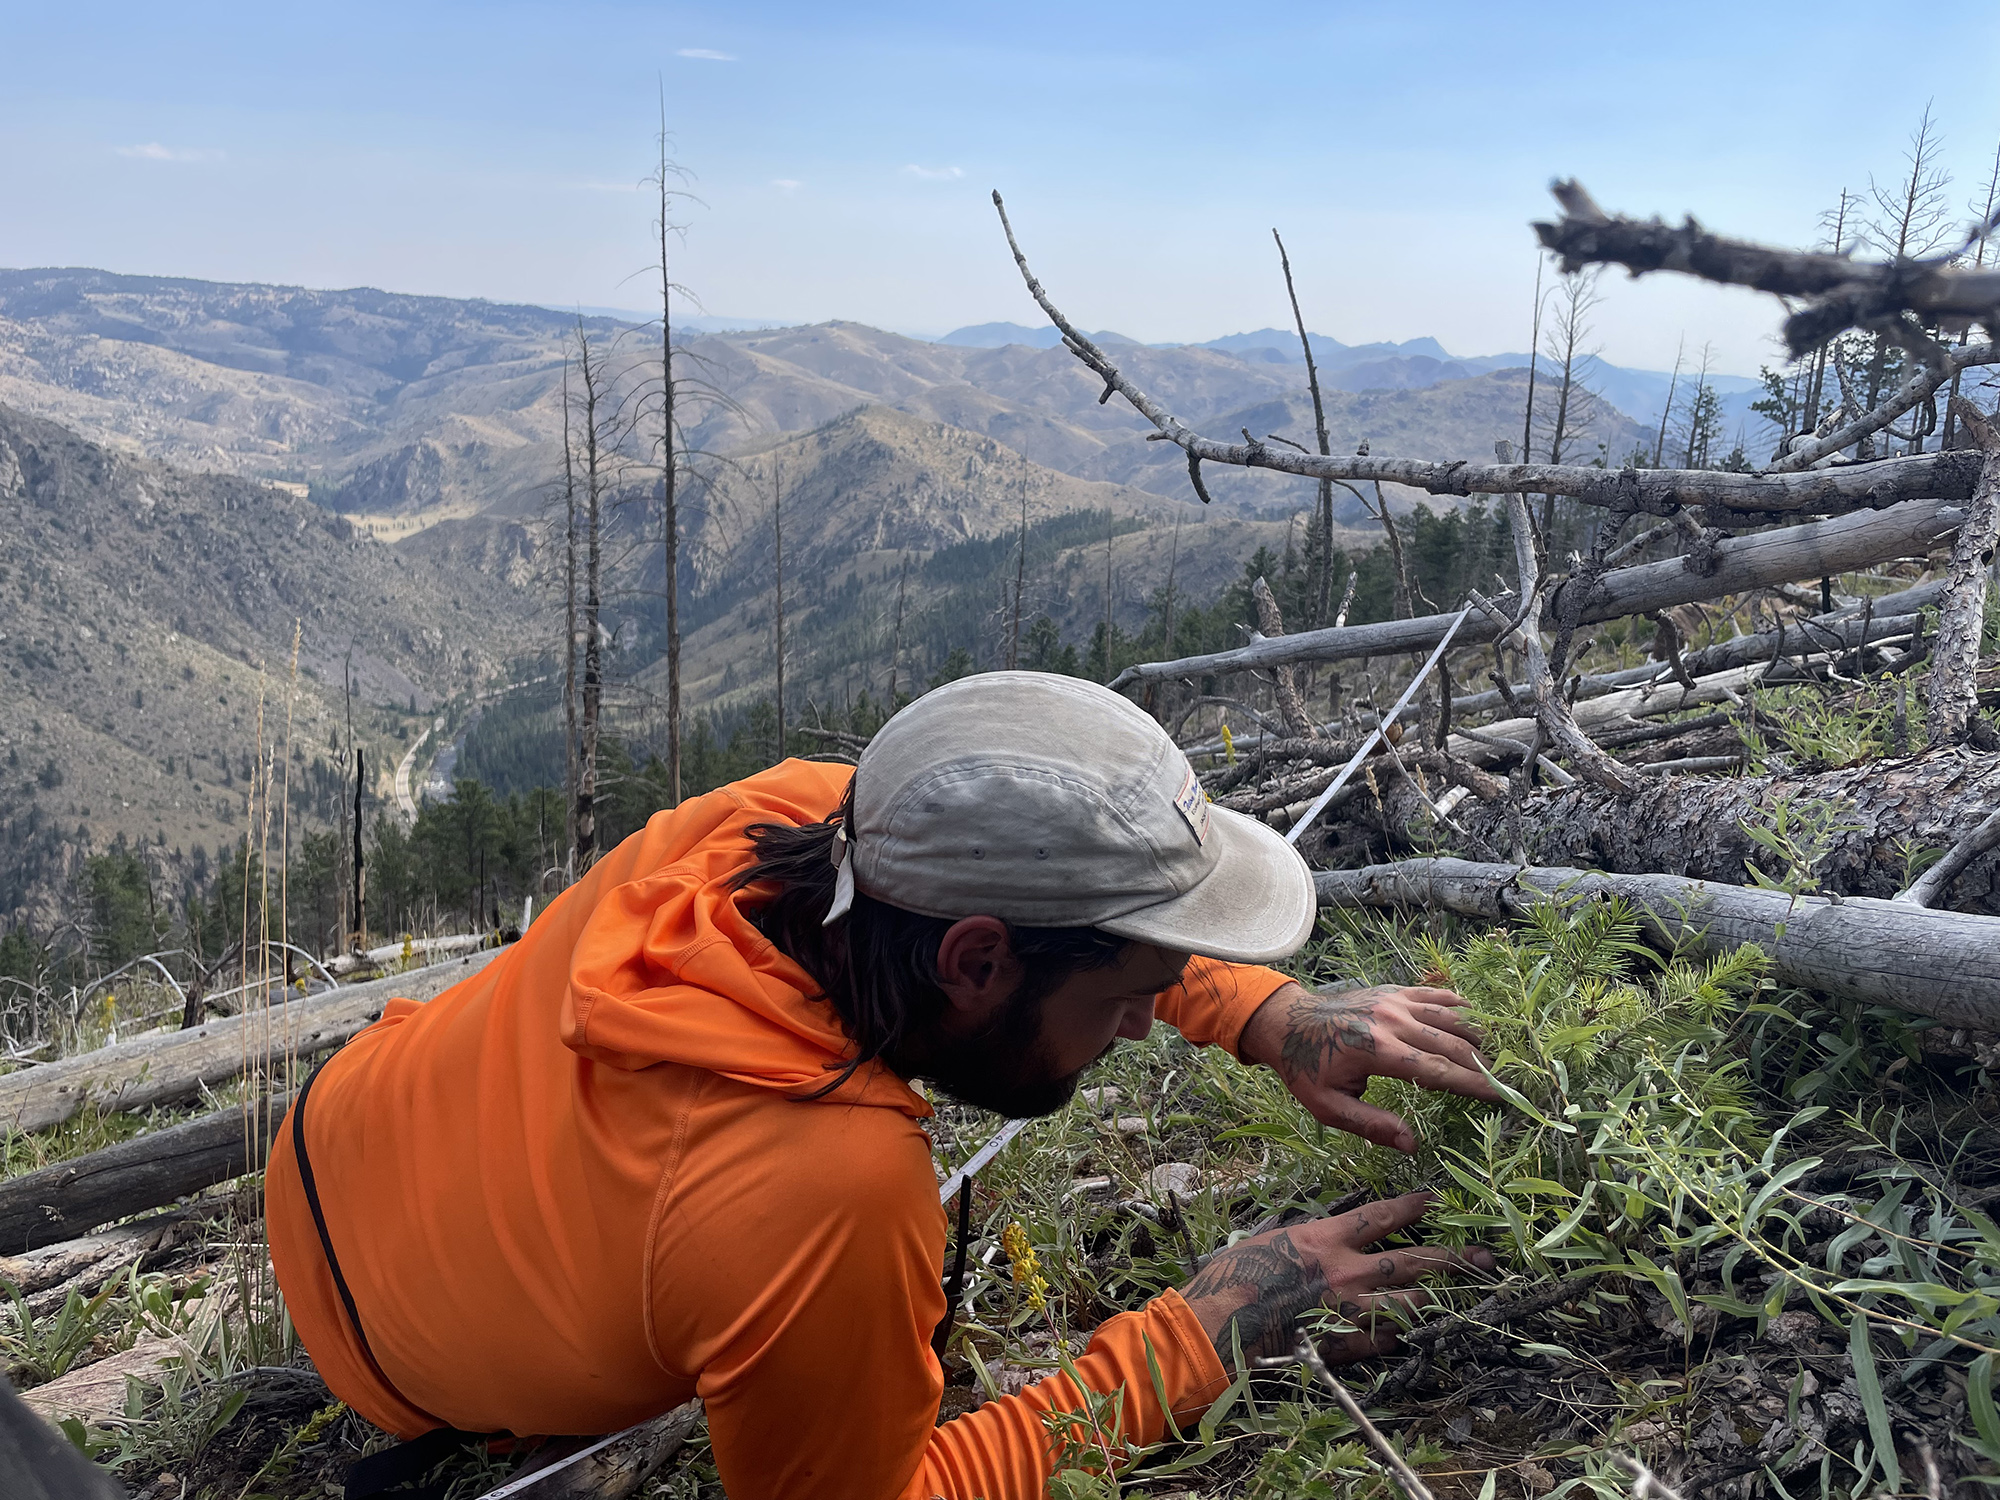
When you walk through a forest a few months after it’s burned in a severe wildfire, trees are killed and charred, and the ground is black and grey with ash. You come out covered in charcoal, like you’ve just put your face into a campfire. But it's also often a time of dynamic growth and change. Tree seedlings are sprouting from the ash. It's amazing to see.
In less severely burned areas, the smaller trees in the understory — what we call ladder fuels — are often killed, creating more space on the forest floor, but many of the big trees survive.
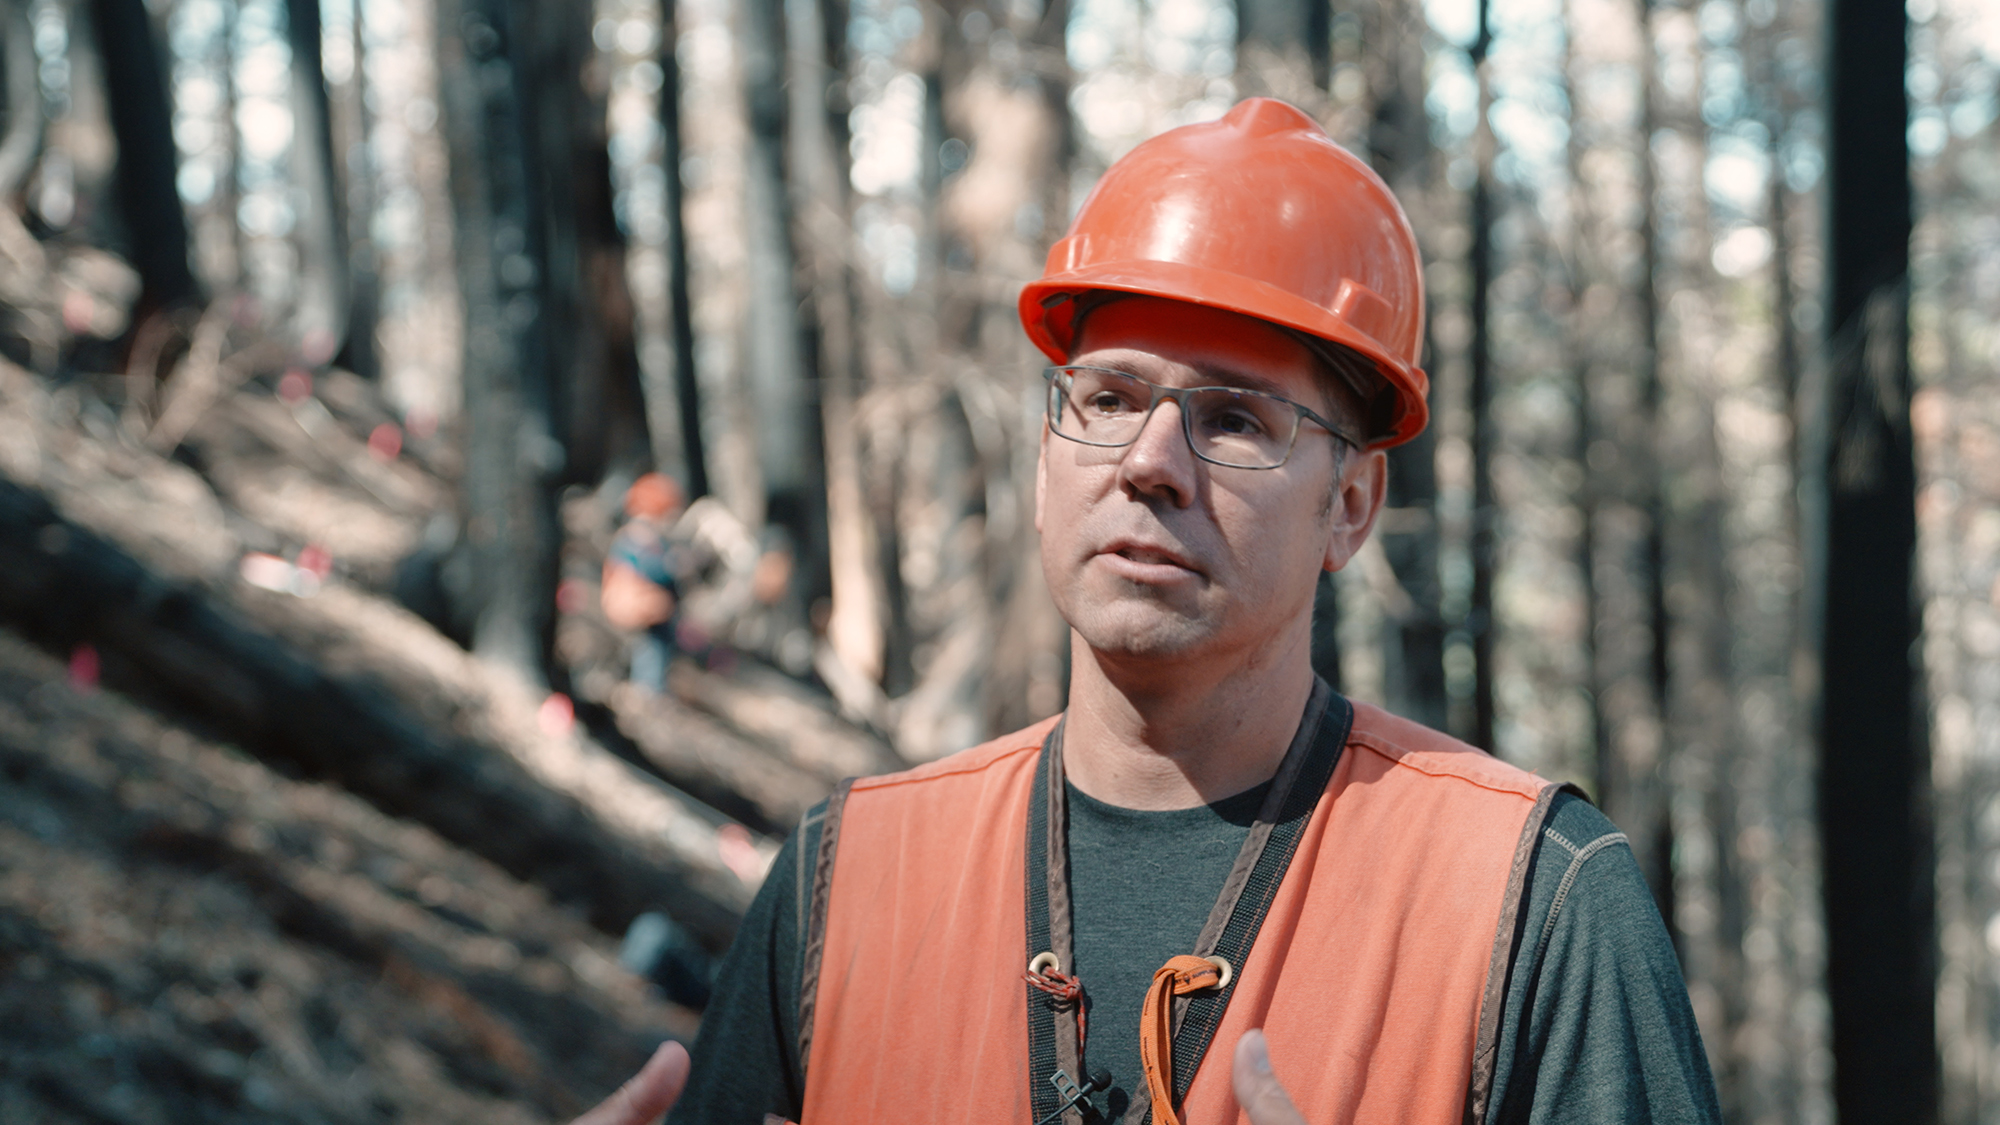
This summer, my teammates and I bushwhacked our way to 80 sites in Colorado, New Mexico, and California that burned in 15 fires during 2024 — ranging from the Borel fire in California that consumed 60,000 acres and destroyed 223 structures, to smaller fires like Spruce Creek in Colorado. As part of our work for the Western Forest and Fire Resilience Collaborative (WFFRC), which I lead here at Cary Institute, we collected field measurements to create an atlas of burn severity that will cover the entire American West. The creation of this atlas is led by WFFRC team member Brian Harvey of the University of Washington.
Why burn severity matters
Burn severity is key to understanding what happens after a fire. Fire is a natural part of many ecosystems. When people and homes aren’t in danger, ecologically beneficial wildfires — with characteristics in line with the historical range of variability prior to Euro-American settlement, which the local trees are adapted to — do good work on the landscape, helping to reduce fuels and revitalize ecosystems. But when climate change or other factors cause fires to diverge from their historical characteristics, they can be ecologically detrimental, burning in ways that cause the forest to recover much more slowly, or perhaps never at all.
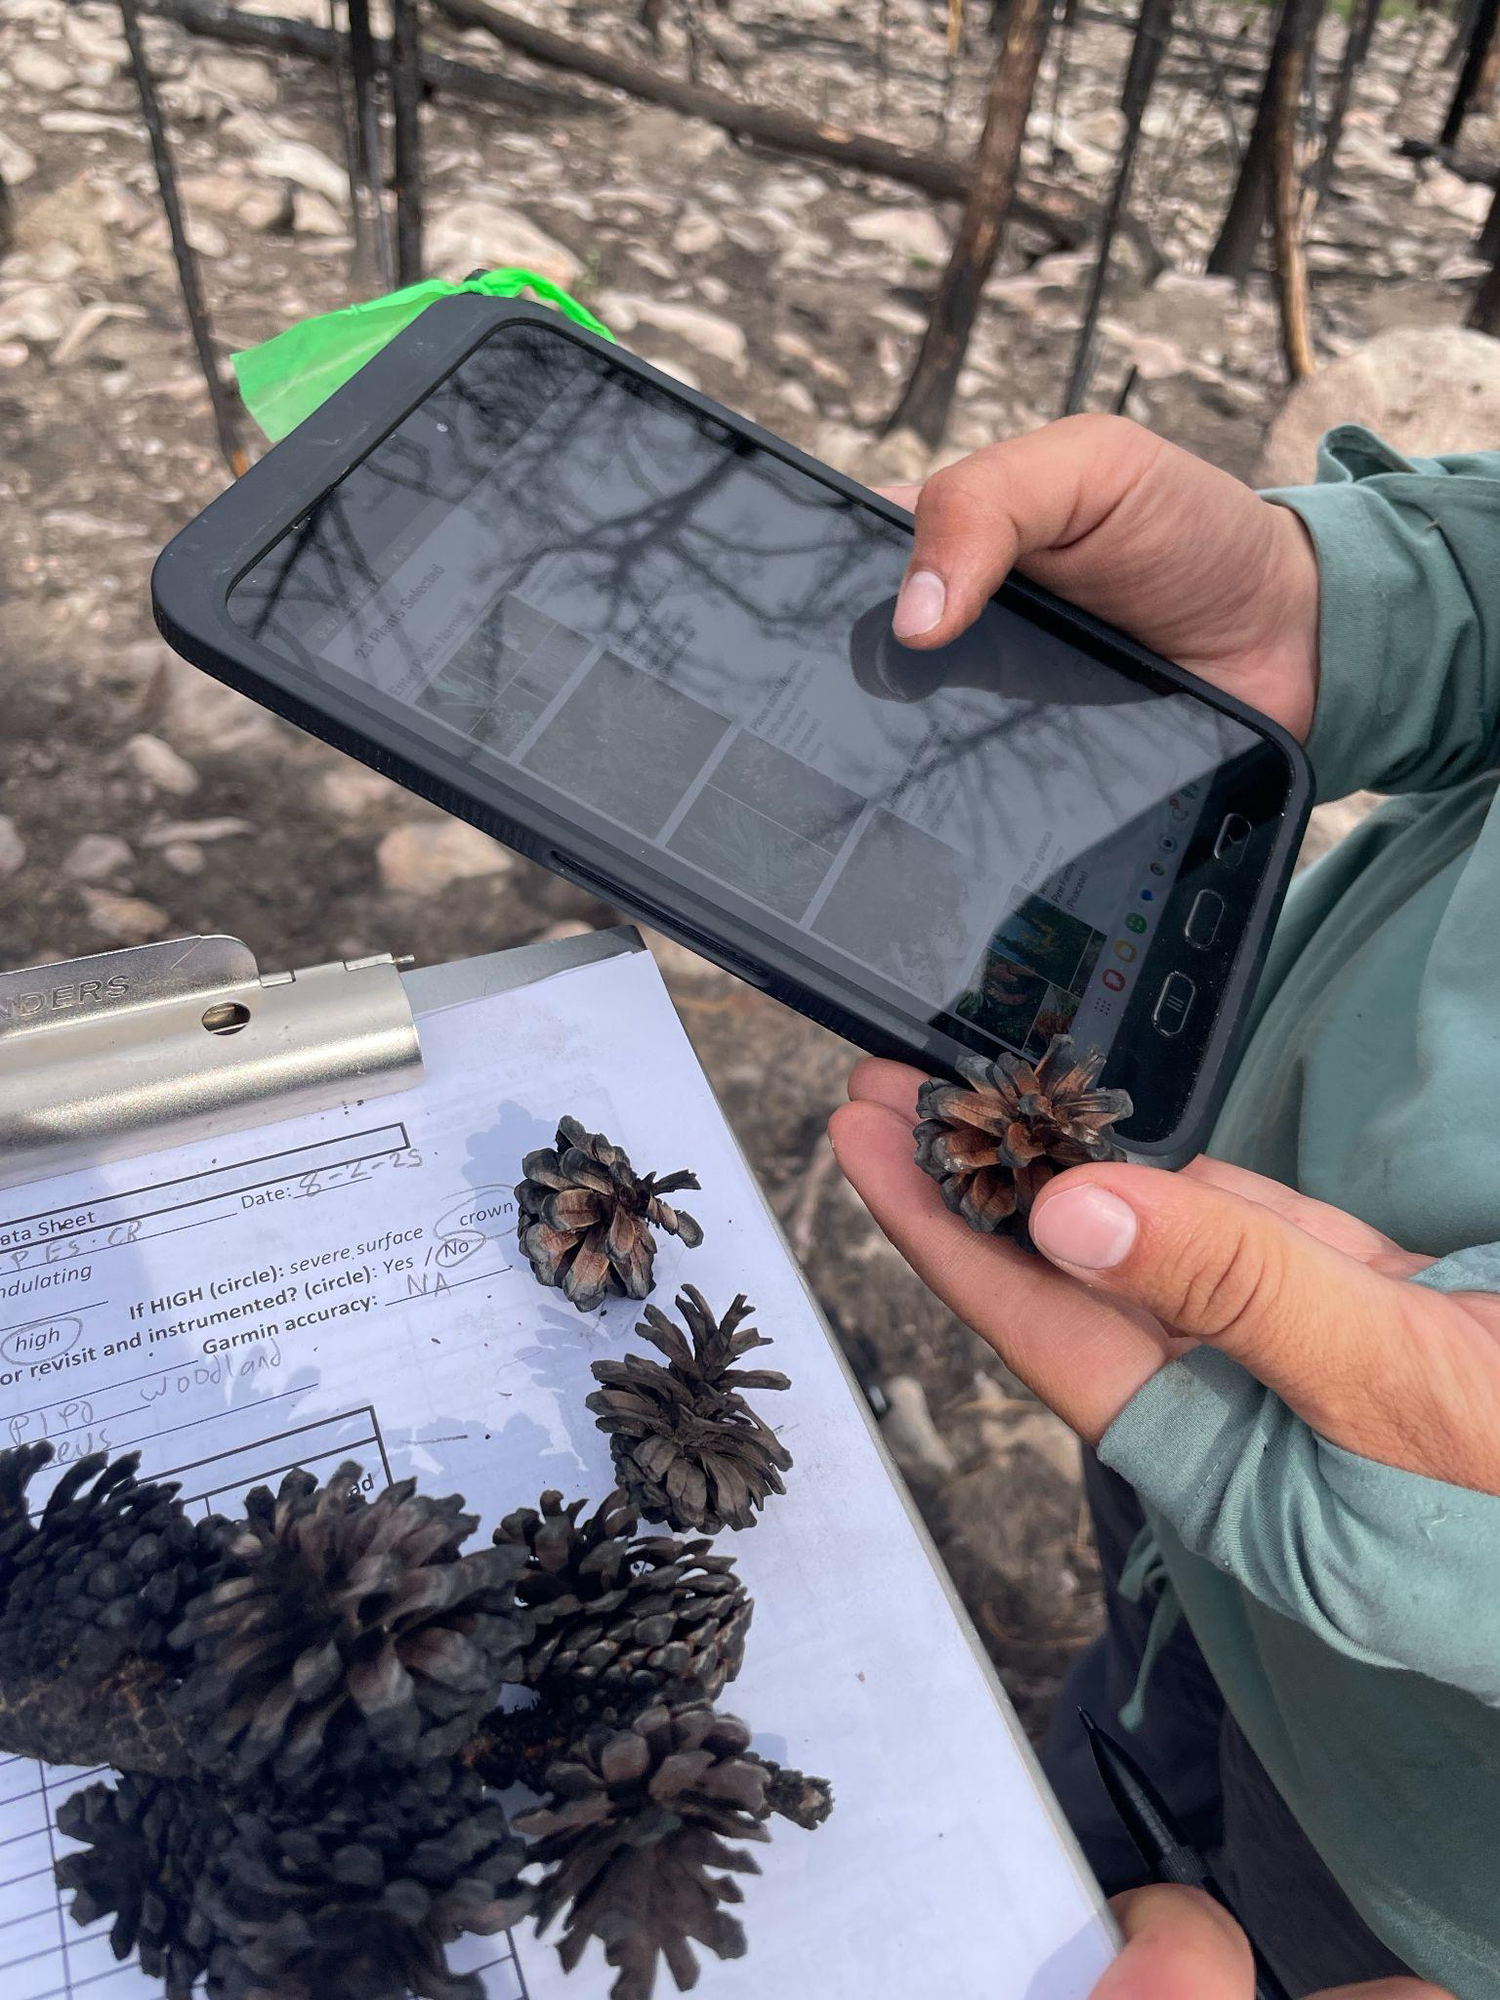
We have a few ways to measure burn severity. Foresters and fire scientists can observe local impacts on the trees and soil, but these studies are labor-intensive and can’t cover much area. Satellites can estimate burn severity across vast areas by measuring each pixel’s change from green to brown after a fire, but they don’t tell us about metrics that we measure on the ground and people can relate to, such as how many trees were killed or extensively charred.
Our team of collaborators is combining field work with statistical modeling to harness the best of both approaches. At each burn site, we measure factors such as the height of char marks on trees, how much canopy cover was lost, the depth of soil charring, and which trees were killed. Members of Brian’s team then leverage powerful computers and statistical models to relate field measurements to the matching pixel in satellite imagery. That allows us to build relationships between the on-the-ground data and change in greenness measured by the satellite. Once scientists understand the relationships between all these variables, the resulting algorithms can then infer on-the-ground conditions for every pixel on the satellite imagery, creating wall-to-wall maps of many individual burn severity attributes.
The burn severity atlas is Brian’s brain child, stemming back to his PhD dissertation where he started collecting field data on different dimensions of burn severity. Through years of field work with dozens of researchers, he and postdoc Michele Buonanduci painstakingly built a fire severity atlas for the Northern Rockies and the Pacific Northwest. Now, with funding from the Gordon and Betty Moore Foundation and Lyda Hill Philanthropies, Brian and Michele are collaborating with WFFRC to expand their work and cover the entire Western US.
We’ll have another extensive field campaign next summer to continue collecting data, and in the interim, Brian and Michele are building a prototype of the atlas, starting to include the data we already have.
Data-backed decision making
When operational in about two years, our burn atlas will help landowners and forest managers evaluate the effectiveness of different actions, by showing how fire severity differs in multiple ways when a wildfire comes upon areas that have been treated with prescribed burning or mechanical thinning, versus not treated. The atlas will also help to better track where ecologically beneficial fires have already reduced ladder fuels and shifted forest structure toward management goals, so that managers know to focus resources in other areas where their efforts will have the largest impact.
Even more exciting, we think our atlas — when combined with new information on fire behavior from FireSat — will be able to inform fire management strategies in real time. When it’s fully up and running in mid-2030, FireSat will be a constellation of satellites dedicated entirely to detecting and tracking wildfires. With FireSat metrics, such as how fast a fire is moving and how much energy it’s releasing, we can use the atlas to predict the fire’s ecological impacts and the best courses of action. This might mean letting a low severity fire burn to reduce fuel buildup, or targeting hotspots where the fire should be cooled down to make sure its impacts will be regenerative rather than detrimental.
We are excited to continue working with managers in federal and state agencies who are interested in using the fire severity atlas to make decisions about managing fire and forests in their domains.


