Objectives
Students will know the effects of deforestation on an ecosystem and be able to use data to explain ways that deforestation impacts a stream.
Overview
Rating:
- Students brainstorm the impacts of deforestation on an ecosystem, using the example of Hubbard Brook.
- Students use data to answer questions
- Students present and discuss results
Materials
- Copies of worksheet
- Photos
- Copies of "Nitrogen in a Disturbed Watershed" and "Nitrogen in an Undisturbed Watershed"
Procedure
Engage:
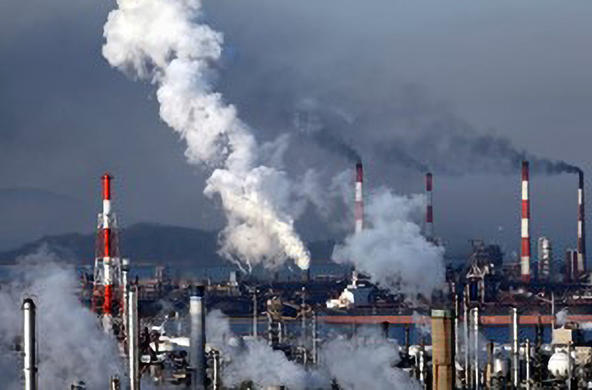
Show students a picture of a deforested area, and ask: What are the impacts of deforestation on the forest? What about on a stream that runs through the forest? Are disturbances good or bad for ecosystems? How can you tell? Does the size of the disturbance matter? Are natural disturbances different from human disturbances? How so? Ask students to justify their statements.
Explore:
Students should use the data to answer the questions on the worksheet, exploring the ideas of disturbance. They should pair-share to check their answers and discuss their ideas.
Explain:
The Hubbard Brook clear-cut experiment is a classic large-scale experiment, begun by Dr. Gene Likens and Dr. Herb Bormann in 1965 in the White Mountains of New Hampshire. They wanted to understand how ecosystems respond to changes on a large scale. Hubbard Brook is a research forest that could relatively easily be sectioned off into different, smaller watersheds (see attached images). Plus, because the underlying geology of the forest is solid bedrock, the scientists could measure all of the inputs and outputs directly in a stream. In 1965, all of the vegetation in watershed 2 was cut; then for the next several years (1966-1969), an herbicide was sprayed over the entire watershed to keep the vegetation from re-growing.
Explain that small disturbances occur regularly and are often essential for ecosystem health. Large disturbances can also be good for ecosystems, but they can also destroy an ecosystem. Consider the different effects of a dry summer, versus a fire, versus a volcanic eruption. Compare these with human disturbances such as creating a foot trail through a forest, building a road, or creating a parking lot in the middle of a forest. Remember that organisms in the ecosystem have had hundreds of thousands of years to adapt to natural disturbances, but had never experienced industrial-age human-caused disturbances until a few hundred years ago.
In 1969, the vegetation was allowed to re-grow. As can be seen in the graphs, deforestation of watershed 2 created significant responses. Stream flow increased—the lack of vegetation decreased the rate of transpiration. Nutrients leached out of the soil at an accelerated rate, since there was a lack of plant nutrient uptake. Ammonium concentrations increased because of an initial increase in decomposition added to the lack of plant uptake. This ammonium was then oxidized into nitrate, which leached into the stream. Other cations also leached out of the soil, with hydrogen ions taking their place.
Extend:
Students should discuss in groups how equal areas of impervious surfaces might affect streams similarly or differently from deforestation. They can then discuss their ideas as a class, form hypotheses, and do online research to determine whether their hypotheses were correct or not. This extension also leads nicely into some of the Hudson Valley: A Social-Ecological System lessons that relate stream water quality to local land use.
Evaluate:
Students should be able to explain why nitrogen levels change in a stream after deforestation.
Resources
Lesson Files
pdf
Deforestation images
pdf
Ecosystem Disturbance Worksheet
Standards
Benchmarks for Science Literacy
5A Diversity of Life, 5D Interdependence of Life, 5E Flow of Matter and Energy, 9B Symbolic Representation, 9D Uncertainty, 12B Computation and Estimation, 12D Communication Skills, 12E Critical-Response SkillsNYS Standards
MST 1 - Mathematical analysis, scientific inquiry, and engineering design, MST 2- Informational Systems/ Information Technology, MST 4- Physical setting, living environment and nature of science, MST 5- Engineering and computer technology to satisfy societal needs, MST 6- Interconnectedness of mathematics, science, and technology (modeling, systems, scale, change, equilibrium, optimization), MST 7- Problem solving using mathematics, science, and technology (working effectively, process and analyze information, presenting results)Credits
References:
Data are a composite from Likens, G.E., F.H. Bormann, R.S. Pierce, and W.A. Reiners. 1978. “Recovery of a deforested ecosystem.” Science 199:492-496.
Lesson is based on an activity by Charlene D’Avanzo from the Teaching Issues and Experiments in Ecology website: http://tiee.ecoed.net . Vol 1, 2004.


