Objectives
Students will know that plants use oxygen underwater and be able to design an experiment that will test this question.
Overview
Rating:
1. Students discuss whether plants need oxygen, or just carbon dioxide
2. Students design experiments to test whether plants use oxygen
3. Students record and report results
4. Students compare their data with data from the Hudson River
Materials
For each group:
- 2 pint or ½ pint glass jars-must be the same size for comparison purposes
- 3 strands of elodea per jar
- aged tap water at room temperature
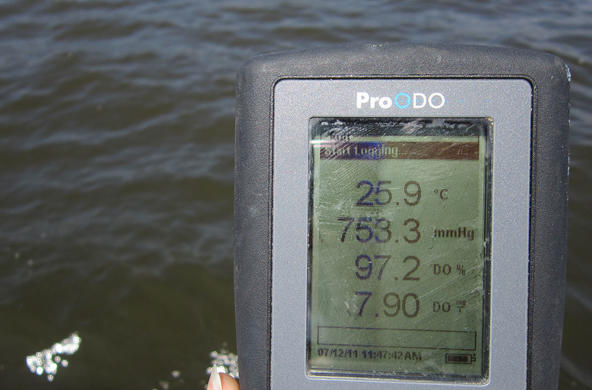
- dissolved oxygen kit
Note: You may also use other types of submerged aquatic plants; just make sure you try to maintain the same amount of plant material in each jar.
Procedure
Engage: Ask: Do plants use oxygen? What about underwater plants? How could you find out?
Explore: Day 1: Show students the materials that are available to them. They should be given enough time in their groups to create an experiment that tests the presence of dissolved oxygen in the water. Check their experimental procedure before you allow them to begin. Most students will create two jars, one as a control, and one with the plants. If you have fish or other creatures from your classroom aquarium, these can also be used. Be careful about using animals, as they may die if the dissolved oxygen levels drop below 4ppm. Remind students that the jars should be left in a dark location overnight, in order to isolate the process of respiration without photosynthesis. Ask students which jar they think will have the most oxygen on the next day.
Note: If using tap water from your school, make sure to allow it to sit for a few days before using. Most tap water tanks have very low dissolved oxygen since the water is stored for long periods of time.
Day 2: Students should check their jars and test for DO. Results should be recorded and discussed with the rest of the class.
Explain: Students may be familiar with the process of photosynthesis, in which plants use carbon dioxide to make oxygen. Review the photosynthesis equation. Students may or may not know about respiration-it is a very common misconception for students of all ages to think that plants only create oxygen. Respiration takes place all the time, not just at night. ALL living things do respiration, not just plants. However, during the daytime, plants are also undergoing photosynthesis, which makes the results complicated. Usually, photosynthesis exceeds respiration, which is why oxygen is released into the water (and air). Temperature affects the rate at which respiration happens, so if the temperature in your classroom changed overnight, this is a variable to discuss with the students.
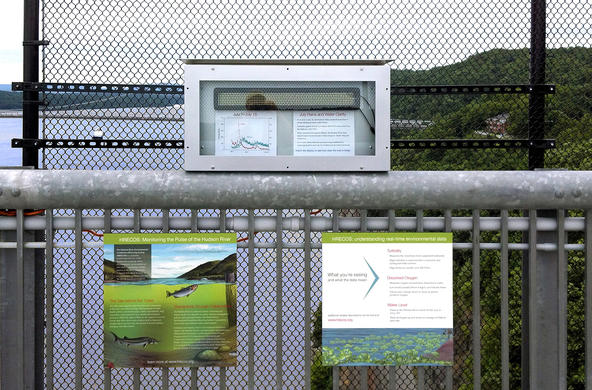
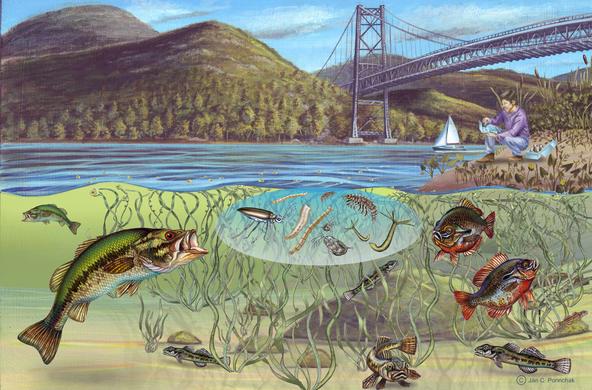
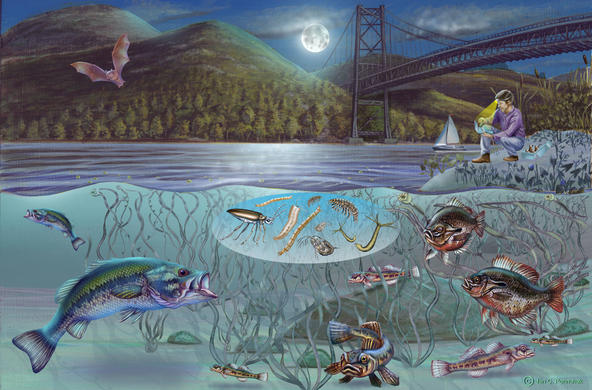
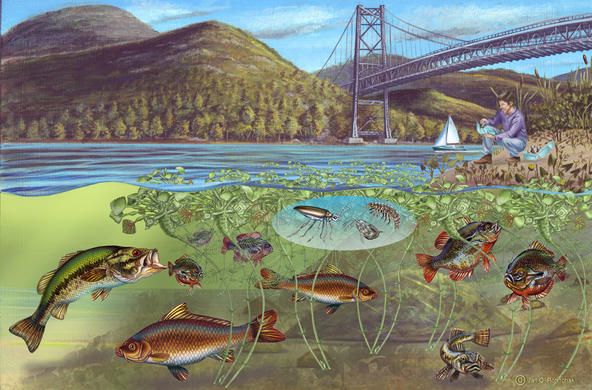
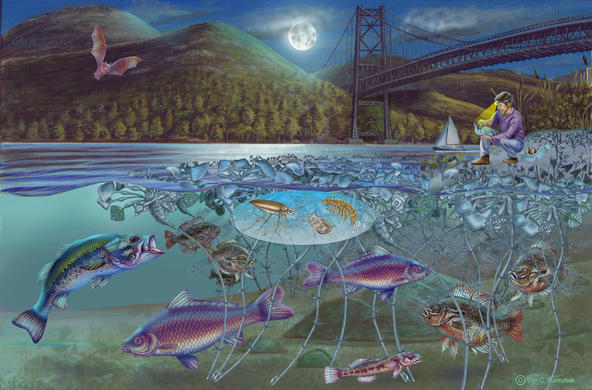
In the Hudson River, during the summer, DO increases during the daytime as phytoplankton and macrophytes photosynthesize. Not only does dissolved oxygen increase during the day, but pH does as well, as carbon dioxide is removed and the water becomes less acidic. In the evening, oxygen and pH decrease, and the lowest concentrations occur just before dawn. In the winter, the change is less dramatic.
Extend: If animals were used, students can spend some time thinking about how to remove the variability of different sizes of the animals. Is there a way to find a constant oxygen use rate? Can you weigh the animals and then divide by the amount of oxygen they used?
Students can create a second graph of dissolved oxygen data over a longer time period, using the data from Cheviot, which extends for five days. Alternatively, students can use the HR-ECOS site (www.hrecos.org ) to look at longer trends throughout the year.
Evaluate: Students should complete the lab report, which includes examining data from a 24-hour time period in the Hudson River. Different versions are provided for graphing in Excel, graphing by hand, or interpreting the data from a provided graph.
Resources
Lesson Files
pdf
Worksheet with data embedded
pdf
Worksheet to use with Excel dataset
pdf
Worksheet with graphs embedded
Standards
Benchmarks for Science Literacy
1B Scientific Inquiry, 1C The scientific enterprise, 2A Patterns and Relationships, 2B Mathematics, Science and Technology, 2C Mathematical InquiryNYS Standards
MST 1 - Mathematical analysis, scientific inquiry, and engineering design, MST 2- Informational Systems/ Information Technology, MST 3- Mathematics in real-world settings, MST 4- Physical setting, living environment and nature of science, MST 6- Interconnectedness of mathematics, science, and technology (modeling, systems, scale, change, equilibrium, optimization), MST 7- Problem solving using mathematics, science, and technology (working effectively, process and analyze information, presenting results)Credits
Experiment idea modified with permission from: “Plants use oxygen?” 1997. Living in Water, National Aquarium in Baltimore, Kendall Hunt Publishing, Iowa.


