Objectives
- Students will know the products and reactants of photosynthesis and be able to explain how the process of photosynthesis affects leaf structure.
- Students will know where light is more and less available and be able to measure the differences in leaf area and stomata density between leaves in the sun and in the shade.
Overview
Rating:
- Students will research and form hypotheses about growth strategies based on characteristics of leaves.
- Students will gather and measure leaf samples and collect data to support or refute their hypotheses.
- Students will compare class data and discuss findings and write a summary reflection on leaf growth.
Materials
- Smartboard or other projector
- Ability to access internet for videos
- Pole cutter
- Balance
- Nail polish
- Clear tape
- Calipers (optional)
- For each student group:
- Clippers
- Scissors
- Ruler
- Microscope
- Plastic bags
- Card stock
- Slide
- Marker
- Growth Strategies Worksheet
- Growth Strategies Reading and Reading Questions
Procedure
Preparation:
You may want to have prepared groups depending on how students work together. Make sure you have enough collecting materials for the individual groups unless collecting will be done as a class. This activity can be extended to compare the results of trees in different parts of the campus ie. inner forest, edge, etc., which may require different groups collecting from various locations at the same time to conserve time. Teachers may want to be in a computer lab (or have computers available) for the first day and also once students are ready to average data, place in tables, and graph.
Engage:
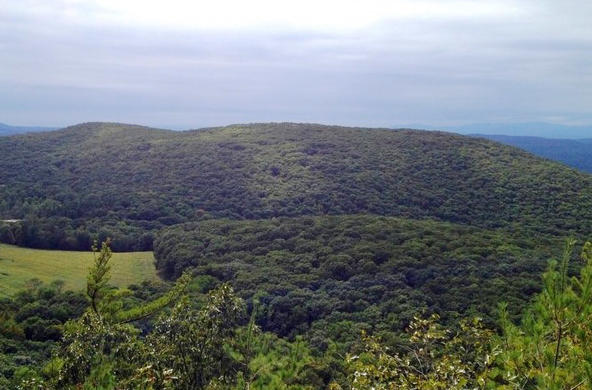
Have students reflect on the previous observations of the school woodlands. Ask “How could we describe the trees in our environment?” Foster a discussion around the different types of trees the students have identified earlier. Ask students if they noticed any types of adaptations from one tree to the next. Ask if they observed any differences in a single tree, and if so, if these differences are based on our specific biome or would they see this in trees anywhere. Have students comment on the general shapes of tree and ask if they notice a pattern (show a picture of typical deciduous trees from the area on smartboard). Does the height of the tree or the density of other trees around the tree affect the patterns? Have students draw pictures of what they think a leaf that gets a lot of light looks like versus a leaf that is more shaded. Have students show their drawings and explain the rationale behind them. This will provide insight into whether students are aware of possible differences between sun and shade leaves, and whether they are aware of any of the mechanisms causing these differences.
Explore:
Day 1: Put the students into teams, and then pass out the growth strategies worksheet and have students work on the pre-investigation questions. These initial questions (1-4) are geared at having students recall some basic information learned during the previous outside activities and discussions. Direct students to go to the site https://gabrielhemery.com/2011/06/20/sun-and-shade-leaves/. This article can also be printed out and is attached to this lesson plan; however the online version has highlighted vocabulary words with links to definitions for those who need it. Give students time to read the article (10 minutes or less). Start a short discussion of what students learned from the article and whether it confirmed any information that was previously suspected. Ask if they think that the information in the article is true and whether they can think of a way to test it. Students should answer the reading questions for homework or in class if time permits.
Day 2: Introduce the general idea of the lab as a way of seeing if the information in the article is valid. You may also want to have a mini discussion related to the underlying question of the lab: do the physical characteristics of leaves differ based on their location on a tree? After this introduction, have students resume the worksheet with questions 5-7 and develop a hypothesis for how leaf size, thickness, and stomata density would differ between leaves at the top of the tree and at the bottom.
Field Investigation
Tell students they will be going outside to collect leaves. Establish or review rules for working outside before leaving the classroom, including the signal you will use to gather them together as a group. Remind students to write down observations while they are outside, and to label all the leaves they collect. Once outside, you should demonstrate using the pole cutter to retrieve leaves from higher in the tree. You may want to collect the high leaves for the students groups, or assign a single student to use the pole cutter. If the pole cutter is not practical for your class, then students can collect leaves from the interior (shade) and exterior (sun) of the trees. Groups should gather several leaves from each location to ensure they have extra.
Day 3: Return to the classroom and have student groups select one leaf from each location and begin gathering data. Have them examine the leaves for general differences. If you have extra time, ask groups to create a table to organize their comparison of the various characteristics they observe—such as petiole length, venation differences, or lobe depth and number—in addition to leaf surface area, thickness, and stomata density. Groups also measure weight, since they obtain surface area and thickness indirectly through the use of ratios.
After obtaining and recording the leaf’s weight, students trace an outline of their leaf on a piece of card stock (e.g., file folder), carefully cut it out, and obtain its weight as well. They then measure, cut out, and weigh a 10 × 10 cm square of the same card stock. After setting up a ratio with the known surface area over its weight, and x over the weight of the outline, students solve for x to determine leaf surface area:
Surface area of paper square = ___ __x_________
Weight of paper square Weight of leaf outline
Surface area can also be determined using the free Easy Leaf Area app for Android and iPhone, available through the app store. To determine leaf thickness, students divide the surface area of a leaf by its dry weight. If available, calipers can be used get leaf thickness as well.
Day 4: To count stomata, students first have to make a transparent mold of their leaves, which is viewed using a microscope. On the bottom of each leaf, they cover an area of about 2 cm2 with a thin layer of clear nail polish; when it has dried, they place a piece of transparent (not “magic”) tape over the area and press gently. They then remove the tape and polish, stick the tape to a clean microscope slide, and mark it to indicate the type of leaf (sun or shade). They can now view the slide under the microscope. Students locate a suitable area using low power, switch to high power, and count the number of stomata in the field of view. They then move the slide and count stomata in two more areas. Finally, they calculate an average to determine the leaf’s stomata density (the number of stomata/ field of view).
Explain:
Day 5: Once groups have gathered their data, compare as a class by filling in a class data table projected on the smartboard. Through these comparisons, students should notice the variation among leaves from the same area of the tree and identify possible sources of experimental error. You may also discuss differences between different species of trees if there is time. Lead students to a discussion of the validity of their data and reinforce the necessity of having information from multiple leaves from each tree location and the significance of an average versus individual data points. Show them how it also provides them with multiple data points for their analyses.
Obtain averages as a class and then discuss the validity of the differences observed between top and bottom leaves. Since averages can be deceptive, the question becomes: “Is there enough difference between the two groups of data to say you are certain your hypothesis is correct?” Here, you can differentiate the content. For high-level students, you can use statistics and perform a t-test to detect differences between the means. The concept, though, is easy to see visually using graphs and looking for areas of overlap in the data sets. In this case, graphing the means with error (i.e., standard deviation) bars shows areas of overlap. The greater the degree of overlap, the lower the certainty that a significant difference exists between the data sets.
After they create their graphs, have students critically examine their data and decide whether their hypotheses are supported or need to be modified. According to their background research, students should find that the top leaves are smaller, thicker, and have a lower stomata density than bottom leaves. But this is not always the case. Due to natural variation, and student sample choice, leaf surface area will not consistently show the expected small (top) versus large (bottom) relationship. Stomata density can also be problematic, usually due to errors made while counting. Thickness should be more reliable but can also encounter problems due to natural variation and math errors. The majority of the evidence should show a trend that supports the research.
Background:
For most plants, leaves are the main organ of photosynthesis. They have evolved various shapes to maximize the use of available light, permit carbon dioxide (CO2) access to internal cells, and limit the potential for water (H2O) loss. Thus leaves tend to be broad, to increase surface area for light absorption, and thin, to enhance diffusion of CO2 and H2O vapor to interior cells. The density of their stomata—the pores in the leaf that control gas exchange—tends to vary according to the geographical region’s temperature and humidity. Variations in leaf surface area, thickness, and stomata density are a response to local environmental challenges and can be seen as a balance of the functional costs and benefits. Thin leaves with large surface areas, for example, work well in shady conditions but lose water rapidly in full sunlight. Thick leaves have additional chloroplasts found in lower layers that take advantage of intense sunlight but are more resource intensive to build, and their diffusion of CO2 and H2O is less efficient. Stomata density is also problematic, since intense sunlight increases temperatures and promotes water loss while increased leaf thickness decreases the CO2 available for photosynthesis. Trees that grow taller experience variations in available sunlight, water, and wind from top to bottom—creating microclimates where changes in leaf characteristics provide potential benefits. Given this information, students can contemplate how plants manage the trade-off between light capture, CO2 collection, and water loss.
Extend:
- Have students predict if a different tree species will follow the same pattern. Also have them think about locations of trees. Ask them if they think that trees in the inner forest will yield the same results as trees on the edge. What about isolated trees in an open area versus those that line the street, or trees on the east side of campus versus the west?
- Have student teams do a transpiration experiment (using light bulbs or fans) to test transpiration rate differences between the sun and the shade leaf.
- Have students present their findings as part of a science symposium, science fair, Board of Education Meeting, PTA meeting, etc.
Evaluate: give students a picture of a leaf with its size, thickness, surface area, and stomata density listed next to the picture, and ask them to decide where on the tree the leaf came from, and to justify their answer.
Resources
Lesson Files
vnd.openxmlformats-officedocument.wordprocessingml.document
Student Reading
vnd.openxmlformats-officedocument.wordprocessingml.document
Student Reading Questions
vnd.openxmlformats-officedocument.wordprocessingml.document
Student Worksheet
Standards
Benchmarks for Science Literacy
2A Patterns and Relationships, 5E Flow of Matter and Energy, 11C Constancy and Change, 12D Communication SkillsNYS Standards
MST 1 - Mathematical analysis, scientific inquiry, and engineering design, MST 4- Physical setting, living environment and nature of science, MST 6- Interconnectedness of mathematics, science, and technology (modeling, systems, scale, change, equilibrium, optimization), MST 7- Problem solving using mathematics, science, and technology (working effectively, process and analyze information, presenting results)Credits
modified from Joy Auclair, Adapting to the Environment, NSTA, 10/14


