Use the filter to limit your results.


Objectives
Students will know how the zebra mussel invasion has changed the Hudson River and be able to use graphed data to explain the history of these changes.
Overview
Rating:
- Students discuss possible impacts of zebra mussels on the Hudson River ecosystem
- Students play a population dynamics game.
- Students graph the data collected during the game and compare it with the zebra mussel data collected by scientists.
- Students report and discuss results.
Materials
- Pictures of zebra mussels and/or (nonliving) examples collected from the river
- Copies of the ZM game data recording sheet – print each chart on a different sheet
- Clipboard or hard surface for the data recorder to write on
- Lab goggles (enough for nearly all students) or roll of flagging tape
- Copies of the lab handout
- Computers with Microsoft Office Excel and/or graphing paper
- Copies of “Zebra Mussel Fact Sheet” to hand out
Procedure
Preparation:
Familiarize yourself with the rules of the game. It is based on the ‘Oh Deer!’ game created by Project Wild.
Engage:
Show the students pictures or examples of zebra mussels and the native unionid mussels. Ask: What do you know about the zebra mussel invasion? Remind students that the invasion began in the Hudson River in 1991. If students haven’t done the introduction to the invasive species lesson, use images from that PowerPoint to pique interest. Ask what they think happened to the native mussel population, the population of plankton and water clarity. Record their hypotheses on the board.
Explore:
Day 1-2:Game time!
Students play the game “Mussel Your Way In” (instructions below).
- Divide the class into two groups—one small group (2-3 students) of native unionid mussels and one large group of resources.
- Explain that in this game they are going to be native mussels in the Hudson River and, for the purposes of this game, the two resources that they need to survive – plankton (food) and rocks (a place to live). Demonstrate how to make the symbols for each resource. For plankton, place your hands over your stomach. For rocks, raise your arms and put your hands together to form a triangle over your head. Tell them that the data recorder (usually the teacher) will be keeping track of how many animals and resources are in each round.
- Establish two horizontal lines ~10-15 meters apart in an open area. Put the mussels behind one line and the resources behind the other.
- Have the mussels and the resources turn around on the line so that they cannot see one another. Everyone will decide on a resource. The mussels are deciding which component they need or want; the resources are deciding what they are. Each person makes the symbol for his or her chosen resource. Before you say ‘Go!’ for them to turn around, count and record the number of mussels, rocks, and plankton. Mussels are easy to count, since they are on one side, and the rocks should be easy to pick out, since they will have their hands over their heads. (Note that you are not keeping track of what resource the mussels want –just the numbers of mussels, rocks, and plankton at the beginning of each round.)
- When you say ‘Go!’ the resources should mill about throughout the space between the two lines. The mussels should look for their resource. Once the mussels have found the resources they want, they link hands with that resource and walk back behind the “mussels” line. Since this mussel has found the resource it needed, it will “use” the resource and be able to survive and reproduce, so the person who was the resource will now become a mussel. Note: Neither the mussel nor the resource can change symbols once they have decided on one during each bout of selection.
- Any mussel that fails to find the resource they needed “dies” and will become a resource. The resource person can only satisfy one mussel, so if two or more mussels try to get the same one, only the first one to reach the resource person survives.
- Starting with number 4, repeat the process for a total of 10-15 rounds, each beginning with the new assignments from the previous round.
- The leader should record the number of mussels and of each resource type at the beginning of each round. Running about 10-15 rounds of selection is usually adequate to let participants see how population and resource abundance interact.
- In order to help kids understand how an invasive species impacts native species populations, repeat the game with three other variations:
9a. Introduce a predator to the system. Begin with: 1 predator, 3-5 native mussels, and the rest of the students as resources. The predator stands in between the two lines and tries to tag native mussels. Any native mussel he or she tags becomes a resource. If the predator tags 2 native mussels, the predator gets to pick one of them to become a predator. However, if the predator doesn’t get any mussels for 2 successive rounds, they “die” and become a resource. As before, keep track of mussel, predator, and resource populations for 10-15 rounds. This activity demonstrates the effect of predator-prey dynamics on a system. Note: without telling the predators that they must begin in between the two lines, the predator(s) may stand right behind their prey before they turn around. Decide beforehand if you would like to allow for this impromptu ‘stalking’ behavior. After all of the games have been played, you can discuss how an invasive predator may be compared to these ‘stalking’ predators—their prey don’t even know that they should be watching out for this new predator, which they’ve never before experienced in all of their evolutionary history. In natural systems, prey have evolved mechanisms to hide from or detect predators long before they would get the chance to come so close!
9b. Introduce 2 invasive zebra mussels to the system. Give students lab goggles or hand them a piece of flagging tape to identify them. Begin with: 2 zebra mussels, 2 native mussels, and the rest of the students as resources. Give new zebra mussels goggles or lab tape as needed and have them hand them/it to you when they become resources again. Continue to keep track of the numbers of each kind of mussel and resource as before (10-15 rounds). This activity will help students see how resource competition affects population sizes.
9c. Play the game with both the invasive species and the predator in the system: Begin with 3 zebra mussels (with goggles/tab tape), 3 native mussels, 1 predator, and the rest of the students as resources. Tell the predators that they can tag native mussels ONLY. Invasive species tend to have few or no predators in their new environment, while the native species, having a long evolutionary history with the region, do have natural predators. As before, keep track of mussel, predator, and resource populations for 10-15 rounds. This final activity demonstrates two common ways that an invasive species impacts a system—they both compete for resources and because they tend to have few predators, they tend to increase predation pressure on native populations.
Day 2-3: Graphing game dynamics
At the end of the game, divide students into four groups. Give each group one set of the population data from one of the four versions of the game and a large sheet of paper or poster board. Instruct them to plot the data, numbering the y-axis by 5’s to ~35 (or the number of students in your class) and the x-axis up to the number of “years” (rounds) that you repeated the game. Instruct students to plot the values of the zebra mussels and each of the resources on their graphs using a different color or symbol for each population or resource value (native mussels, zebra mussels, plankton, rocks, predators). Discuss axes labels so that students will make sure to graph appropriately (“Resource or population abundance” versus “Year”). **Students often have a hard time creating anything besides a bar plot. They will probably need help to be guided through the process of plotting the points and connecting the points with a line.
Have the students work with their group to tell a story about how and why the mussel population sizes increased and decreased over the years (i.e. there was an abundance of all resources, so the population went up; there was a lot of plankton, but not many rocks to live on, so their populations went down; the zebra mussel populations increased a lot, because they didn’t have any predators; the predator populations fell when there were few native mussels left). Have each group tell the class their story, beginning with the ‘no competition’ scenario (the first version described) and ending with the ‘predation + competition’ scenario (Step 9c, above). Ensure each student gets to tell part of the story, citing data from the graph so that everyone can see on the graph the story they are telling (e.g. ‘In the first two years, there were few mussels and abundant resources, so their populations increased rapidly’). Guide each group to recognize the basic population principle(s) their game version demonstrates (‘no competition, with limited resources;’ ‘competition with limited resources’ [9a]; ‘predator-prey with limited resources’ [9b]; ‘predator-prey + competition with limited resources’ [9c]).
They should be able to discuss how the resources worked as limiting factors for the population’s ability to grow. They should also recognize that both resource availability and the population size are dynamic, and that predators play an important role in moderating population sizes. In groups, have them compare the similarities and differences between the unionid mussel population dynamics and the zebra mussel population dynamics. Encourage the students to ask each other questions.
Day 4: Telling stories with real data
Next, students will look at real data collected by Cary IES scientists. If possible, each student should be able to work at his/her own computer. If no computers are available, or you’d like the students to graph by hand, another version of the worksheet is available with the data. The students should have familiarity with Excel (use the Excel tutorial if necessary). The third option is to use the pre-made graphs embedded in the worksheet.
Explain the objectives of the lab and provide them with a copy of the instructions, making sure they have been able to find their way to Excel. **Be sure to point out that “no data” (“nd”) does NOT mean 0.0. They should simply leave these spaces blank (Excel) or not graph them (if they are graphing by hand). Encourage the students to ask for help when they get stuck and to show you their results and graphs during the exercise. Another common mistake occurs when they are asked to highlight the second set of data points that they want to graph. Many students include the title, when only the data points should be highlighted. They should also be shown how to name and save their graphs.
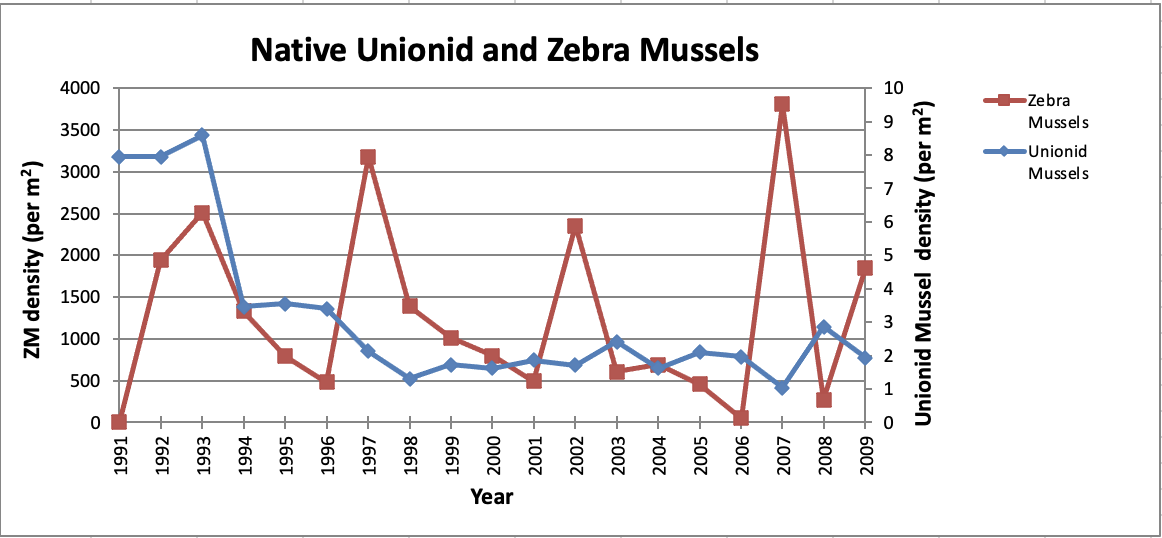
After reading about how scientists have collected the data in the Hudson River, the students will make two sets of graphs. The first set of graphs will show students how phytoplankton and zooplankton populations have changed in response to the zebra mussel invasion, and the second set of graphs will look at water chemistry and transparency. An example of a graph is provided below for reference. See “Worksheet with graphs embedded” for more example graphs.
Explain:
Zebra mussels were first detected in the Hudson in 1991. By 1992 they had spread throughout the freshwater and slightly brackish parts of the estuary and had a biomass greater than the combined biomass of all other consumers (fish, zooplankton, zoobenthos, bacteria) in the river. The mussels filter the equivalent of all of the water in the Hudson River about once every four days. Native mussels, one of the most rapidly declining animal groups in the U.S., are the largest group of federally listed endangered or threatened invertebrates. Of nearly 300 species of mussels in North America, 13 are considered extinct and 57 are designated federally endangered or threatened species. In the Hudson, their major competitor is the zebra mussel. After the introduction of zebra mussels, populations of phytoplankton and small zooplankton plummeted. Plankton are pillars of the riverine food web, and their decline has effects on all of the life in the river. For example, the zebra mussels filter out so many small plankton that the number of open water (often planktivorous—plankton-eating), fish has decreased, while there has been an increase in the number of fish that depend on shallow-water, vegetated areas. Zooplankton such as cladocerans and larger copepods have not decreased, because they are too large for zebra mussels to eat. Water clarity has increased, while nutrient levels have decreased, due to there being far fewer plankton in the water column. Students should be encouraged to think about how other factors may regulate the changes in the river, besides the zebra mussels. Dissolved oxygen levels have decreased as well. Besides inducing many ecological changes, zebra mussels have also caused economic damage in the Hudson. They attach to water intakes, boat hulls, and other submerged objects in very high numbers. Estimates for zebra mussel damage in the Hudson ranges from $100,000 to $1million per year.
Extend:
Students can read further about zebra mussels and their effects on the Hudson River in the “Zebra Mussel Fact Sheet.” They can also make additional graphs and generate more hypotheses using the data provided.
Evaluate:
Students should be able to explain how the population of the zebra mussels has affected other biotic components of the ecosystem.
Comments: The ‘Mussel Your Way In’ game was modified from the popular ‘Oh Deer!’ game created by Project Wild (www.projectwild.org).
Resources
Lesson Files
pdf
Worksheet with tables embedded
pdf
Worksheet to be used with provided data set
pdf
Worksheet with graphs embedded
pdf
Zebra Mussel Game Data Sheet
vnd.openxmlformats-officedocument.presentationml.presentation
Zebra Mussels PPT