Objectives
Students will know how to answer the question, “Are some fish less harmful to eat from the Hudson River than others?” and be able to provide evidence to support their answer.
Overview
Rating:
1. Students brainstorm what they would need to know in order to decide if they should eat different kinds of Hudson River fish.
2. Students will explore fish data from the Hudson River.
3. Students will share their results and discuss the implications for consumption.
Key Concepts: species differences, pollution, sampling and variability, frequency histograms
A PDF of this Lesson Plan is available for download under the "Resources" tab.
Materials
- Species Info Cards
- Student worksheets
- Species data cards in four envelopes (one envelope per species)
Procedure
Preparation:
- Cut out the Species Info Cards; consider laminating them for longevity.
- Copy and cut out the fish data cards and place each fish species data in the appropriate envelope.
- Decide how many groups you would like - you need four groups (or multiples of four so that each species is represented equally).
Engage:
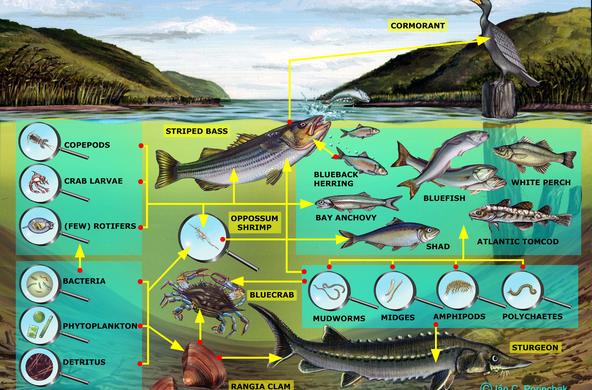
- Ask students to work in pairs to answer the question: “What would you need to know in order to answer the question - Do different fish species have different PCB levels?” Monitor students’ progress and make sure they aren’t trying to answer the question directly, but instead are making a list of things they would like to know. This might include:
Example questions | Background information on this question |
Where do the fish live?
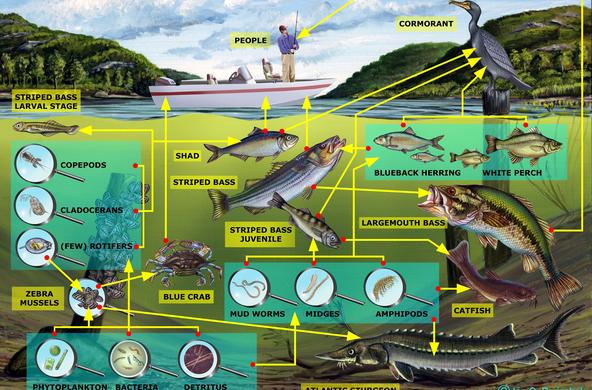
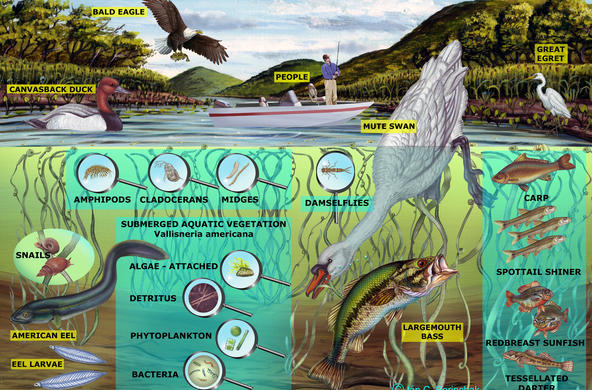
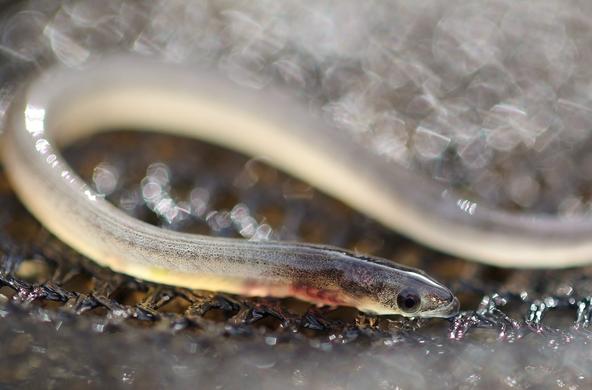
| Many fish species in the Hudson River are diadromous, which means they spend parts of their lives in different water bodies. We have both anadromous and catadromous fish. Anadromous fish are born in freshwater but spend the rest of their lives in the ocean, with the exception of breeding periods. Catadromous fish are born in the ocean and spend the rest of their lives in fresh water until returning to the ocean to spawn. Salmon, shad, striped bass, and sturgeon are anadromous; eels are catadromous.
Fish are also migratory within the estuary, spending time in different areas depending on the time of year and availability of prey. |
How old and how big are the fish?
| Older fish tend to bioaccumulate more PCBs. Striped bass can be an exception to this, as sometimes the younger, smaller fish have higher PCB levels than older fish because they spend more time in contaminated areas. |
How long have they spent in the Hudson River?
| Fish that have spent more time in the Hudson River, as compared to the ocean, tend to have accumulated more PCBs. |
What do the fish eat? Does diet vary between species?
| Conventional wisdom says that bottom-feeding fish tend to accumulate more PCBs in their bodies because they ingest sediment while they eat, and the sediment is laden with PCBs. However, this is not always the case - in the Hudson, brown bullhead PCB levels are much lower than catfish, even though both are thought of as "bottom feeders". Hence, the amount of fatty tissue (% lipid) is has a bigger impact than feeding habits. |
Does their food have different amounts of contamination?
| Fish diet is very important, and if a fish eats larger organisms that themselves might have accumulated more PCBs, they in turn will have higher levels. |
Where else do the fish live?
| If the fish spend considerable time in other water bodies, we would need to know more about the contaminant levels in those places. |
How fatty are the fish? | Different fish have different fat levels, and fat accumulates PCBs more than other body tissues. Fat also accumulates at different rates depending on the amount of food available. Waste production and laying eggs can also reduce the amount of PCBs in a fish. |
- Ask students to share the questions that they have generated, and create a list on the board. Now, as a group discussion, ask students to brainstorm what kinds of data they might want in order to answer the question. Students may want data from the last ten years for all species– talk about the feasibility of data collection at this scale, and then introduce the activity: “Today, we will be looking at data about PCB contamination in several different species from the Hudson River, to see if some fish are safer to eat than others."
Explore:
- Hand out the worksheets, and ask students to complete the review questions in Part 1 (they may have to return to the reading provided in Lesson 1). Ask students to justify their choice for which fish species will have the highest PCB level.
- Divide students into four groups (or multiples of four groups). Each group will receive a Species Info Card. They should follow directions in Part 2 of the worksheet, making sure to calculate the average % lipid levels for their fish species before reporting out to the class. Note: The yearly lipid levels were created by taking an annual average from all of the data provided.
- It may be helpful to project the graphic organizer so that students can follow along as information about each species is shared. To complete Part 2, students should answer the questions about which fish species will have the highest PCB levels. To check for comprehension, talk through students' answers to question #3 and ask them to justify their choices.
- In Part 3, students will be given an envelope that contains PCB contaminant data for their fish species in 2011. They should select at least 15 data points (they can do all of the data points if time allows) and plot them on the graph provided. *Note: students with catfish data may have points that are larger than the axis provided, and you may have students use their own graph paper so that these can be included, or just plot the outliers above the graph. Students should also calculate the average PCB level in their fish and mark it on the graph. Once students have completed the sampling activity, ask each group to explain their results, including the average for 2011. An example of what the graph should look like is in the PDF of the Lesson Plan.
- In Part 4, as a class, students should add the data for all of the fish to their graphs, including the average from each species in 2011. You may also make a bar graph of just the averages, which will be similar to the one in the PDF of the Lesson Plan (however, depending on the number of samples selected, the exact averages may vary slightly, especially for striped bass). These data include fish collected from all locations in 2011 (spring/summer data only):
- Then, show students all of the raw data for all years by projecting this image (available in the PDF of the Lesson Plan). These data are the individual fish PCB levels from Catskill for ten years.
- Ask students to reflect on what is missing when they only see an average for a location for one year. Students should point out that there is a lot of variability for some fish species, especially catfish. Ask students whether they would want to use data from the most recent year, or all of the available data, to create a fish advisory?
- Students should then be able to answer the questions in Part 4, where they summarize their understanding of how PCB contamination varies by species, and why.
- To explore the reasons behind the differences in PCB levels, show students the graph in the PDF of the Lesson Plan that demonstrates the differences in average % lipid in the four different species over four years.Thus, although catfish always tend to have higher levels of PCBs than other species, sometimes a fish might have a higher lipid level, and thus be potentially more contaminated with PCBs than in another year (for example, the brown bullhead in 2001 as compared with 2008 or 2011). Students should create a scientific argument, including a claim, evidence, and reasoning, using the PCB level data and % lipid.
Explain:
- Fish accumulate PCBs in their bodies by eating smaller organisms that contain PCBs. Fish like striped bass also migrate throughout the estuary, with adults spending the majority of their lives in the open ocean. Consequently, PCB levels will vary based on the size and age of the fish, the location where it lives and has lived, and what it eats. Fish accumulate the PCBs in their bodies, and especially in their fat cells, from eating smaller fish or plankton that are contaminated. These are called "lipid" cells, which is a general term for molecules that contain hydrocarbons and make up many of the building blocks of cells, including fats, waxes, sterols, and some vitamins and hormones. Consequently, if a fish species is high in lipids or is very "fatty", such as a catfish, or if an individual fish accumulated a lot of fat over the course of the year, it will have a higher PCB contamination level than a thinner fish.
- There are many factors, however, that affect the PCB levels in different fish species and the advice on eating them. Walleye have historically been found in the Hudson near Albany and Troy and they had high levels of PCBs. North of Catskill the DOH advice has been that no one should eat them. In 2013 walleye were collected for the first time further south in the Hudson, at Rondout Creek. People like to catch and eat walleye and the DEC has stocked them in a number of tributaries to the Hudson, including Rondout Creek. The walleye collected in 2013/2014 in the Rondout Creek near Kingston had high levels of PCBs, and NYS DOH moved walleye from an “up to once a month” into the "Do Not Eat" category along with catfish and eels. Walleye eat other fish and can live up to 30 years. The DEC tagged sixteen walleye in the creek, and thus were able to understand where the fish went over the course of the year. Six of the fish stayed in the creek, and the other ten moved out into the main Hudson river after spawning.
Extend:
To extend your data exploration with students, consider having students look at additional species and/or years.
Evaluate: Using exit slips, ask students to answer the following: Which fish would you eat from the Hudson River? Explain your answer.
New York State Science Learning Standards
MS-LS2-4. Construct an argument supported by empirical evidence that changes to physical or biological components of an ecosystem affect populations. [Clarification Statement: Emphasis is on recognizing patterns in data and making warranted inferences about shifts in populations due to changes in the ecosystem.]
Science and Engineering Practices | Disciplinary Core Ideas | Cross-Cutting Concepts |
1. Asking questions and defining problems | LS2A: Interdependent Relationships in Ecosystems | 1. Patterns |
3. Planning and carrying out investigations | LS2C: Ecosystem Dynamics, Functioning and Resilience | 3. Scale, proportion, quantity |
4. Analyzing and interpreting data | LS4D: Biodiversity and Humans | 4. Systems and system models |
5. Using mathematics and computational thinking |
| 7. Stability and change |
7. Engaging in argument from evidence |
|
|
Resources
Lesson Files
pdf
Fish Cards with PCB levels
vnd.openxmlformats-officedocument.presentationml.presentation
Species Information Cards
vnd.openxmlformats-officedocument.wordprocessingml.document
Worksheet for Lesson 3
pdf
Worksheet Answer Key
pdf
Lesson Plan-Lesson 3


