Objectives
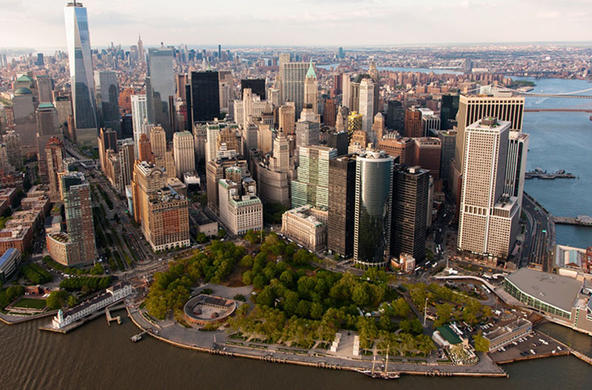
Students will analyze historic sea level data, sea level projections, climate projections, coastal flooding projections, and NYC action plans. They will make comparisons among the data and predict the preparedness of NYC to withstand sea level rise.
Overview
Rating:
- Students will discuss IPCC sea level data and predict the effect of sea level rise on the NYC area.
- Students will use a NOAA interactive map to compare flooding levels in three different areas of NYC.
- Students will read about climate trends, flooding impacts, and NYC recommendations and actions.
- Students will compare sea level rise data and projections to the data collected in this unit and assess the effectiveness of NYC’s flooding action plans.
Materials
- Student readings: The Cost of Climate Change; NYS Sea Level Rise Task Force Report; As Sea Level Rises, Hudson River Wetlands May Expand
- Powerpoint Climate Change and Sea Level Rise
- Computers with internet access
- Digital copies of the Student Handout Future of the Hudson & NYC(with links to NOAA and NYC.gov embedded)
- NOAA Sea Level Rise Viewer
- Optional: Scenic Hudson Sea Level Rise Mapper (here)
- Projector
Procedure
Preparation:
Students should be familiar with the concept of climate change. Assign The Cost of Climate Change and excerpts from the NYS Sea Level Rise Task Force report as reading before class.
Provide a digital link to the Student Handout Future of the Hudson & NYC and link teacher computer to a projector. A teacher key to the worksheet can be found in the resources section.
Engage: Ask, “Has your house, or the house of someone you know, ever been flooded? If so, how long did it take to recover?” Lead a brief discussion about the impacts of flooding. Ask, “What are all the climate change factors that can impact sea level?” Show slides that show the impact of sea level rise and the graph of historic data and data projections from the Google Slides presentation. Ask students to take out their flood predictions (exit ticket) from yesterday, and tell them that they will be able to determine their predictions were accurate.
Explore:
1. Project Slide 35 “Rate of GMSLR has been greater since the mid-19th century.” Discuss reason for this data trend. Then project Slide 36 “Regional sea level rise by the end of the 21st century”. Discuss the possible reasons why different regions of the earth are predicted to have differing amounts of sea level rise. What are the consequences? Students complete the “Do Now” section of the worksheet.
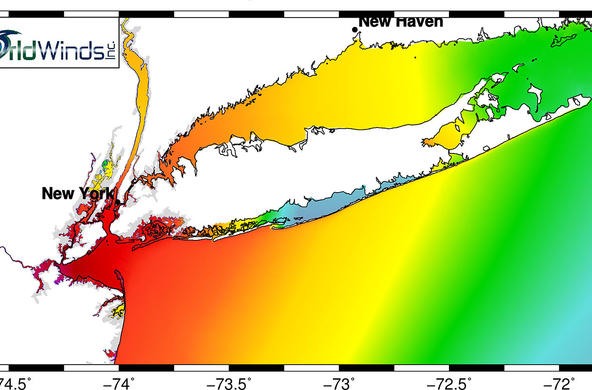
2. Show students the NOAA Sea Level Rise Viewer. Allow students time to view a variety of flooding levels at the following NYC area locations: Fulton Street, Coney Island, and West Babylon. Debrief student observations. Students complete the “Independent Practice 1” portion of the worksheet.
3. Students read the NPCC document sections about climate trends, flooding impacts, and NYC recommendations and action plans. Students complete the “Independent Practice 2” portion of the worksheet.
* Alternatively, teachers may give students the wetland reading that focuses on impacts of the entire Hudson River.
4. Students answer the “Evaluate” portion of the worksheet for homework.
Explain:
According to a report from the International Panel on Climate Change (IPCC) in 2013, global mean sea level rise (GMSLR) is the increase in ocean volume. The three causes of GMSLR are: warming of the ocean (thermal expansion), ice loss by glaciers and ice sheets, and decrease in terrestrial water storage. The rate of GMWSLR was a few tenths of a mm/year over the last two millennia, but the graph that is shown on the PowerPoint shows the rate increasing since the mid-19th century. From 1901-1990, the rate was 1.2 mm/year. It increased to a rate of 3.2 mm/year from 1993-2010. IPCC’s Representative Concentration Pathways (RCPs) project a “very likely” increase of GMSLR to 8.5 mm/year by the end of the 21st century. The next slide shows that approximately 95% of the global ocean area will experience sea level rise by the end of the 21st century with 70% of coastlines experiencing change. Finally, projections show that is very likely that future sea level extremes will increase significantly. GMSLR will continue for many centuries beyond 2100 with the numbers dependent on future emissions.
The NOAA Sea Level Rise viewer has several tabs: seal level rise, local scenarios, mapping confidence, marshy migration, vulnerability, and flood frequency.
Extend:
Students may use the NOAA Sea Level Rise viewer to conduct their own investigations.
Students use CER to answer the following questions:
- What are the economic impacts of global warming? What can be done to avoid this economic impact?
- How is the Hudson River responding to climate change? How does this response compare to most other rivers?
Evaluate: Assess student understanding by their answers on the associated worksheet. Assess student responses to the “Evaluate” questions.
Resources
Lesson Files
pdf
Student Handout Future of the Hudson & NYC
vnd.openxmlformats-officedocument.presentationml.presentation
Climate Change and Sea Level Rise PPT
pdf
Teacher Copy NOAA Sea Level ProjectionsAdditional Resources
Student Worksheet:
https://docs.google.com/document/d/1XoDnOxvfDmNJSKGtruP2l-ju1jc9mAsTPcoaG-kIpfI/edit
Standards
Credits
This lesson was created by teachers Rosa Saad and Suzanne Zekonis


