Use the filter to limit your results.


Objectives
Students will know how much water enters and exits their school building, creating a water budget and be able to understand how land cover affects the water that enters the school campus.
Overview
Rating:
- Students complete a schoolyard water budget, determining how much of each type of surface exists, the amount of water that falls on each surface, and what happens to that water.
- Students complete a school water use survey, and consider ways to reduce their water use.
Materials
- Aerial photo of your school building and schoolyard per group (use Google Earth)
- transparencies with a grid
- Long meter tape (10m-30m)
- Ruler
- Clipboard, pencil or pen
Procedure
Engage: Ask the students to imagine that we are going to erect a dome over the school and the school’s property. Would the school run out of water? In pairs, students should list everything they would need to know or research to answer the question. Then, students should draw a diagram of the school-as-ecosystem, showing pathways of water into, within and out of the ecosystem. Challenge them to think about underground sources or stores of water. Ask: what role does soil have in cleaning water, if any? Why are different land surfaces important to water quality?
Explore:
Hand out the aerial photos and the grids, and ask students to quantify the amount of impervious surface in each photo. To do this, students should count the total number of squares, and then divide the number of impermeable surface squares by the total. This will give a percent impermeable surface.
A. Form a group and make a preliminary survey of the campus.
- Get a sense for the overall mix of cover types of the property from the aerial photo.
- Survey the property to identify the different kinds of land cover or surfaces there. Try to
- identify surfaces that you think will hold or transmit water differently. For younger students, ask them to name no more than 3 cover types (such as lawn, asphalt, and roof)
- Name those cover types.
- Using the map and your field observations, mark the map with the boundaries of each patch of land cover or surface.
B. Estimate the area of each category of land cover on the property.
- Choose a “pacer” and estimate her or his pace length by measuring the distance covered after taking 10 paces. Divide this number by 10. Record this in meters/pace.
- Pace the length and width of each patch to estimate its size. You can do this by breaking down a patch into geometric shapes and then using formulas for calculating the area of a rectangle, square and triangle. Calculate and record the area in meters2, then divide by 100 to get cm 2
C. Examine each patch of each cover type and determine where water will go once the rain falls on that patch.
- Look for pathways for water flow - pipes, drains, holes, cracks, wet spots, etc.
- Record proposed pathways on the map or your data sheet.
D. Speculate on the fate of the water input for each cover type.
1. Think about the most common next steps in the movement of water once it has entered each part of the campus ecosystem.
The average absorption rate of soil is 50%, which means the other 50% generally runs off. Of course, this is highly variable depending on the type of soil, plant cover, and degree of saturation. Students can determine the absorption rate experimentally, through research or use the 50% average. Average absorption of asphalt is 0%. Evapotranspiration in New York is 20 inches/yr.
The diagram below may also be helpful.
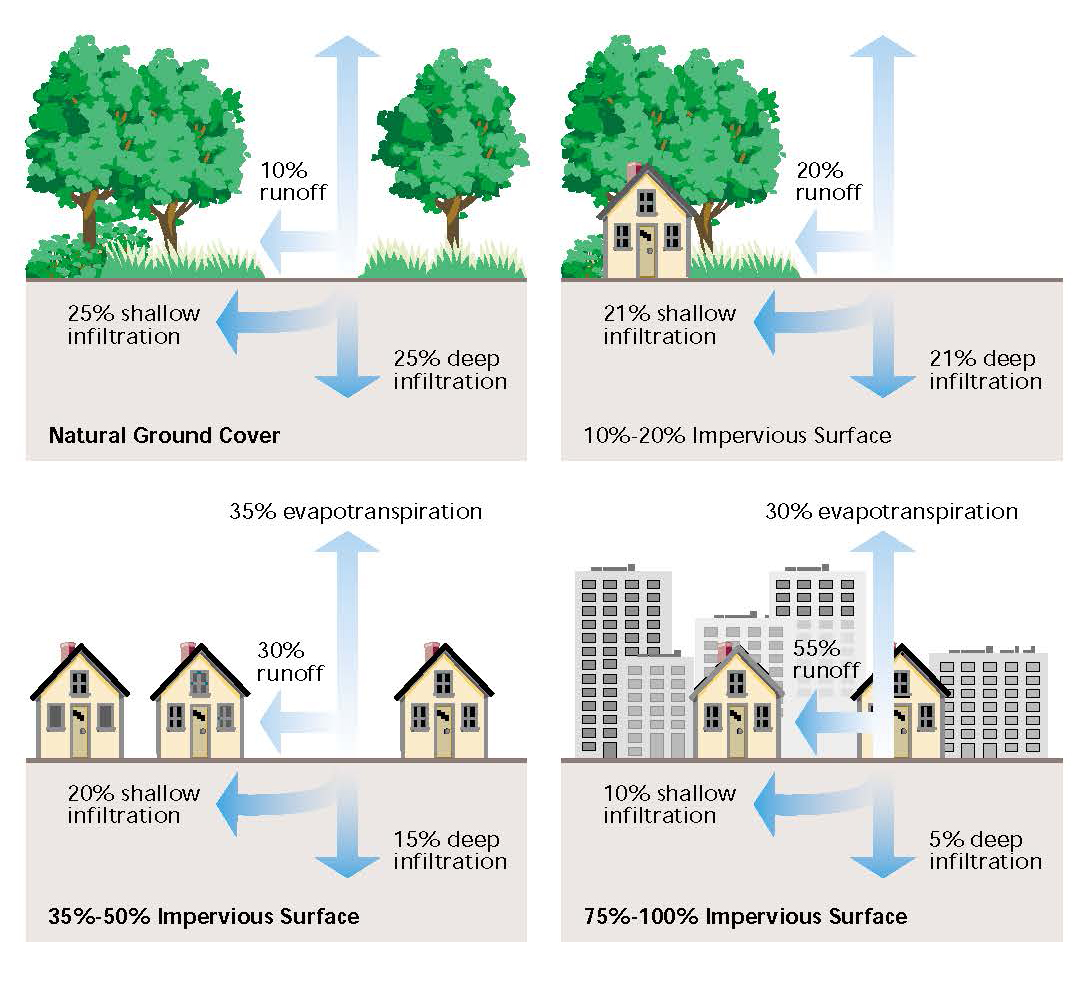
In Stream Corridor Restoration: Principles, Processes, and Practices (10/98) By the Federal Interagency Stream Restoration Working Group (FISRWG) (15 Federal agencies of the U.S.)
2. Create a diagram of the school with numbers that describe how much water enters, what pathways it follows when it arrives and an estimate of how much follows each pathway.
E. Calculate water input budget for each cover type.
- Calculate the amount of water represented by an average annual rainfall hitting each of these total areas:
- The average precipitation in New York is 40inches/year (or 102 cm/yr)
- Multiply 102cm by the area (in cm2) of each cover type.
- This answer, in cm3 is the volume of water that hits that area in one year. Cm3 is the same as mL
- Calculate total water input for the school by adding water inputs of each cover type.
Explain: Every school is different, but this exercise will help students understand the different types of land cover around your school and the amount of water that hits each of these surfaces over the course of a year. This activity involves a lot of math, so make sure to check students’ work along the way. This lesson works well if you combine it with Lesson 3, “Watersheds”, from “An Introduction to the Hudson River”.
Explore 2: Students now think about the inside of their school. Since students don’t drink the water that falls on the surfaces around their school building, they will need to find out where their water comes from, and where it goes.
Estimate human-mediated water inputs and outputs.
- Think about the most important routes by which water may be brought into the school. So far, we have only calculated precipitation!
- Draw in human-meditated pathways into your diagram and calculate the amount of water used at your school based on the school population. On average, a person uses 10 gallons of water per day for drinking, washing, flushing a toilet, etc.
Extend: Students could test the pH of the water before and after it is filtered. Other contaminants can also be added to the water purification system, such as motor oil or road salt.
Evaluate: Students will present their results to the rest of the class, and hand in their worksheets.
Resources
Lesson Files
pdf
Worksheet
pdf
5_5_streams_pervious_surfaces.pdf
pdf
school-water-budget.pdf