Objectives
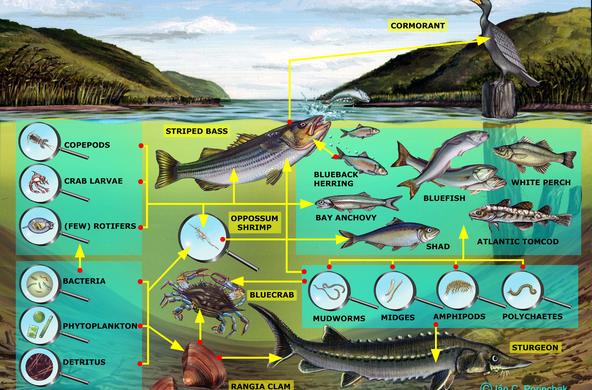
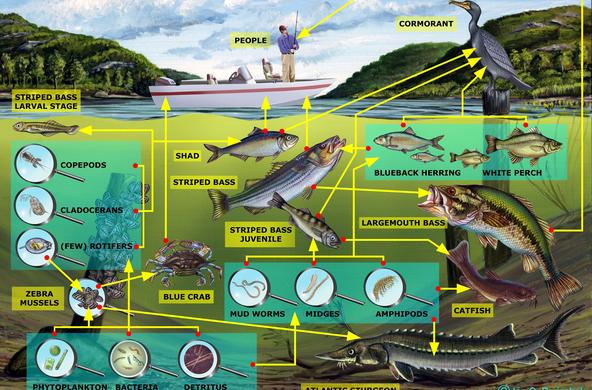
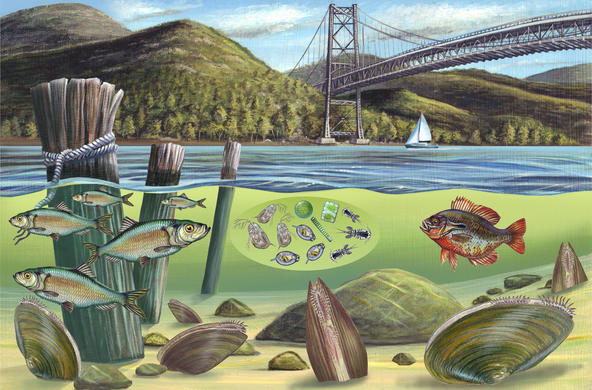
Students will know how the zebra mussel invasion affected the food web of the Hudson River and be able to explain at least two connections within the food web that were affected using evidence from provided graphs.
Overview
Rating:
- Students will share information about a population that they researched for homework.
- Students will participate in a jigsaw activity in which each small group of students explores the effects of zebra mussel on one organism, and shares their findings with classmates.
- Students will make predictions about the future of this ecosystem.
Materials
- Students’ completed “Exploring a population” worksheets from the first lesson.
- Copies of student worksheet (“Zebra mussels & the food web”), which includes graphing instructions.
Procedure
Engage
- Ask: What organisms did you discover live in the Hudson River? On the board, create a list of organisms that they researched for homework.
- Ask: How do you think the zebra mussel invasion will affect your organism? Keep track of whether the students think the population will go up or down in response (e.g. draw up or down arrows next to each organism).
Explore
Jigsaw Part 1 – How will your organism’s population change?: Students will be divided into small “expert” groups of classmates who researched the same organism for homework. Students will make predictions about how zebra mussels will affect (or will not affect) their organism, and provide reasoning based on their research. Organisms are as follows:
- Sphaeriidae (fingernail clams)
- Chlorophyll A (a method for sampling phytoplankton)
- Rotifers (microzooplankton)
- Alosa (open water fish)
- Cladocera (macrozooplankton)
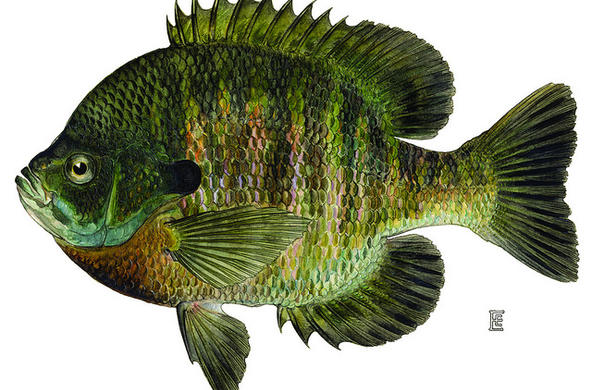
- Centrarchidae (shallow water fish)
- Bacterial abundance (decomposers)
- Copepods (macrozooplankton)
- Copepod nauplii (larval form of macrozooplankton)
- Unionidae (freshwater pearly mussels)
Jigsaw Part 2 – Graphing the results. Students will use the graphing function on the AMNH site to examine what effects the zebra mussel invasion had on the population of aquatic invertebrates they studied. Hand out the worksheet “Zebra mussels & the food web”. Instructions are as follows:
How to access graphing tools:
Visit the following link, or search for AMNH River Ecology:
http://www.amnh.org/education/resources/rfl/web/riverecology/
- Click on Graph The Data
- Select “Over Time”
- Select the Kingston site on the Google map- this site has the most data.
- Select your 1st parameter, then your second. For example, select zebra mussels, than the organism you researched. The drop down lists will have all the populations of organisms discussed so far, as well as other variables (abiotic). This will give you a line graph.
- Next, under Option, select “split the date”. This creates a bar graph that allows you to look at population sizes before and after certain days/years. Select January 1, 1991 as your 1st split date to see the difference in your organism’s population size before and after the invasion.
- There are two tabs at the bottom right of the screen that will allow you to print (left) or download (right) your graphs.
Jigsaw Part 3 – Summarizing results. Students should summarize their results/hypotheses, and answer questions on the “Zebra mussels & the food web” worksheet.
Jigsaw part 4 – Sharing results. After creating a summary in their expert groups, students should split up so that they are each in a group with students from other expert groups. They will fill in a chart on their worksheet as a group to summarize the trends they observed (relationships between their organism and zebra mussels).
Explain
- What does the line graph tell us that the bar graph (split date) does or does not tell us? The bar graph may show us a sharp increase or decrease in population sizes before and after a certain date – these data are averaged for all of the years that are lumped together. Comparatively, the line graph shows us changes in population sizes over time, but the size of certain populations may fluctuate drastically over the course of the zebra mussel invasion. For example, chlorophyll fluctuates by season, as well as over the course of the zebra mussel invasion. Thus, making a clear cut conclusion (“chlorophyll declined”) may be harder to do when viewing the line graph as opposed to the bar graph. Variability is a key concept that students should pay attention to here; the split date option gives you no indication of the variability in the data set.
- Generally, students should observe that zebra mussels had the following results from their graphing exercises in the early invasion years. * Remember that no results are still results. For example, the copepod population does not show a clear trend. Students who can’t observe a clear trend should hypothesize why this might be (experimental error, sample methods, ecosystem effects, lack of predation pressure, etc):
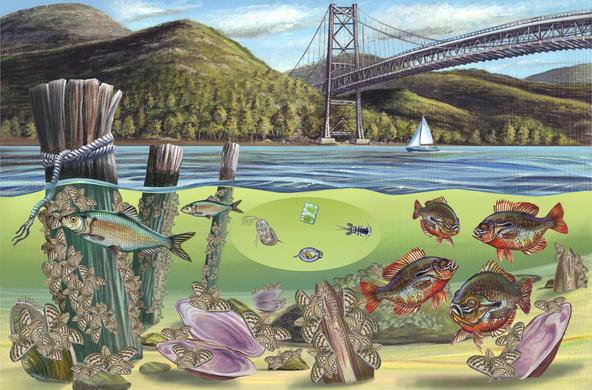
Sphaeriidae (fingernail clams): Declined. Zebra mussels competed for habitat, or covered other bivalve species, preventing them from feeding. Zebra mussels also competed with them by filtering food from water column. Some recovery is evident in recent years.
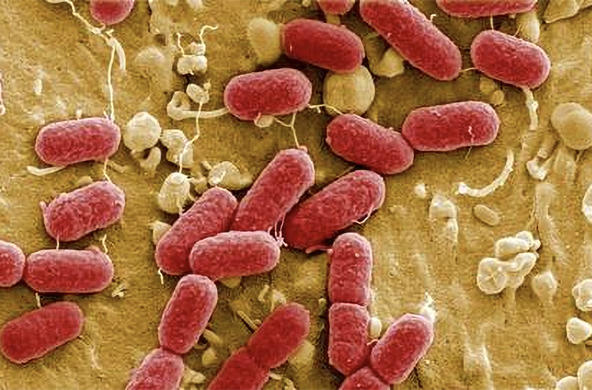
Bacterial Abundance: Increased- an unexpected result. One might expect that bacterial production goes down if zebra mussels ate a lot of the fine organic materials that are coming in from the watershed. Bacteria increased because of the decline in zooplankton, which feed on bacteria.
Cladocera: Declined. There was not a clear trend in these data visible in the line graph, although the split date bar graph makes the decline in cladocera more obvious. Juveniles may have been consumed by zebra mussels via filtration. Larger cladocera had less phytoplankton to feed on because zebra mussels filtered it out of the water column. These organisms may be experiencing a recovery as zebra mussels’ lifespan decreases over time.
Chlorophyll A: Declined. Plant material and phytoplankton were filtered out of the water column (ie consumed) by zebra mussels.
Copepods: No clear trend, especially in the line graph (there is a small decline in this population using the split date option). One might expect these zooplankton to be eaten by larger zebra mussels. However, depending on the size of the zebra mussels and the size of the copepods themselves, they might be too large. Copepods are some of the largest zooplankton in the river.
Copepod nauplii (larval stage): Decreased early in the invasion. These larvae are smaller than the adult form, and thus are easier for zebra mussels to consume. However, they have shown some recovery later in the invasion.
Unionidae (freshwater pearly mussels):** Split date after January 1, 1992, NOT 1991. No data for Unionidea prior to 1992. **Declined after zebra mussel introduction due to a lack of food (chlorophyll). There was a slight increase/recovery after 2006. Note: Some students are concerned with this data set because we do not have a lot of data prior to the invasion. However, we do know that pearly mussels are long-lived animals (living anywhere between 50-150 years). Since the population was relatively high (8 animals/square meter) in the year immediately before and immediately after the invasion (and although zebra mussels were high in the first year, it likely would have taken some time for competition between the mussels to take place), and then plummeted to an average of about 2 animals/square meter, this is similar to understanding what happened to a forest where most of the trees were cut down from one year to the next. If you have data on a forest where, from one year to the next, 60% of the trees are gone, you know that those trees that were there in the previous year didn’t just grow in one year. Similarly, since the pearly mussels are such long-lived animals, we can assume that their populations were fairly high in the decades prior to the zebra mussel invasion.
Rotifers: Declined. These microzooplantkton had less phytoplankton food because of zebra mussels, and likely were consumed by zebra mussels. There are some fluctuations in the later years as zebra mussel populations changed.
Alosa (open water fish): With less zooplankton food available in the water column, these open water, pelagic fish populations declined.
Centrarchidea (fish from vegetated shallows): These littoral fish (occupying the vegetated shallows) showed some decline in their populations after the introduction of zebra mussels. However, the decreased turbidity (cloudiness) of the water due to zebra mussel filtration means that more light reached the habitats of these fish. Therefore, over the long term, the fish benefited from having a more productive habitat. This is not very visible in the line graph, but is clear when using the split date option.
NOTE: These results are not static, and most of the data represented in the graph focuses on the earlier stages of invasion. As the students will be told in later videos, some of these trends change over time. It is important that we keep monitoring the ecology of the Hudson River so that we may see the affects of the zebra mussel unfold further.
Extend
- Students can create a visual to accompany their exploration of a native organism’s population in the Hudson River. They can print their graph(s), create a poster, or download a graph from the AMNH website to be inserted into a powerpoint slide. In this slide, they should include pictures of their organism and facts that they learned about their organism as part of their homework.
Evaluate
- Students should be able to explain at least two changes that the invasion of the zebra mussel caused with regards to the food web.
- Determine if students have met the goal of being able to interpret their graphs by evaluating the following:
a. Can students make conclusions about how zebra mussels affected their organism using descriptive language?
b. Are students able to critique the data presented? For example, some graphs have many data points for one population, but few data points for the other population. How might this affect our ability to interpret this figure? How does it affect our confidence in our conclusion(s)?
Resources
Lesson Files
pdf
Zebra Mussel Lesson 2 Worksheet- ZM and food web
pdf
Answer Key - ZM and food web
pdf
Summary Slides Zebra Population Change


